A 2018 Bullpen Update
Bullpens are notoriously difficult to predict. Baseball is volatile by nature, and relievers even more so. Despite this, many teams invested heavily in relievers over the offseason. Here’s what bullpens are doing so far, one quarter through the season.
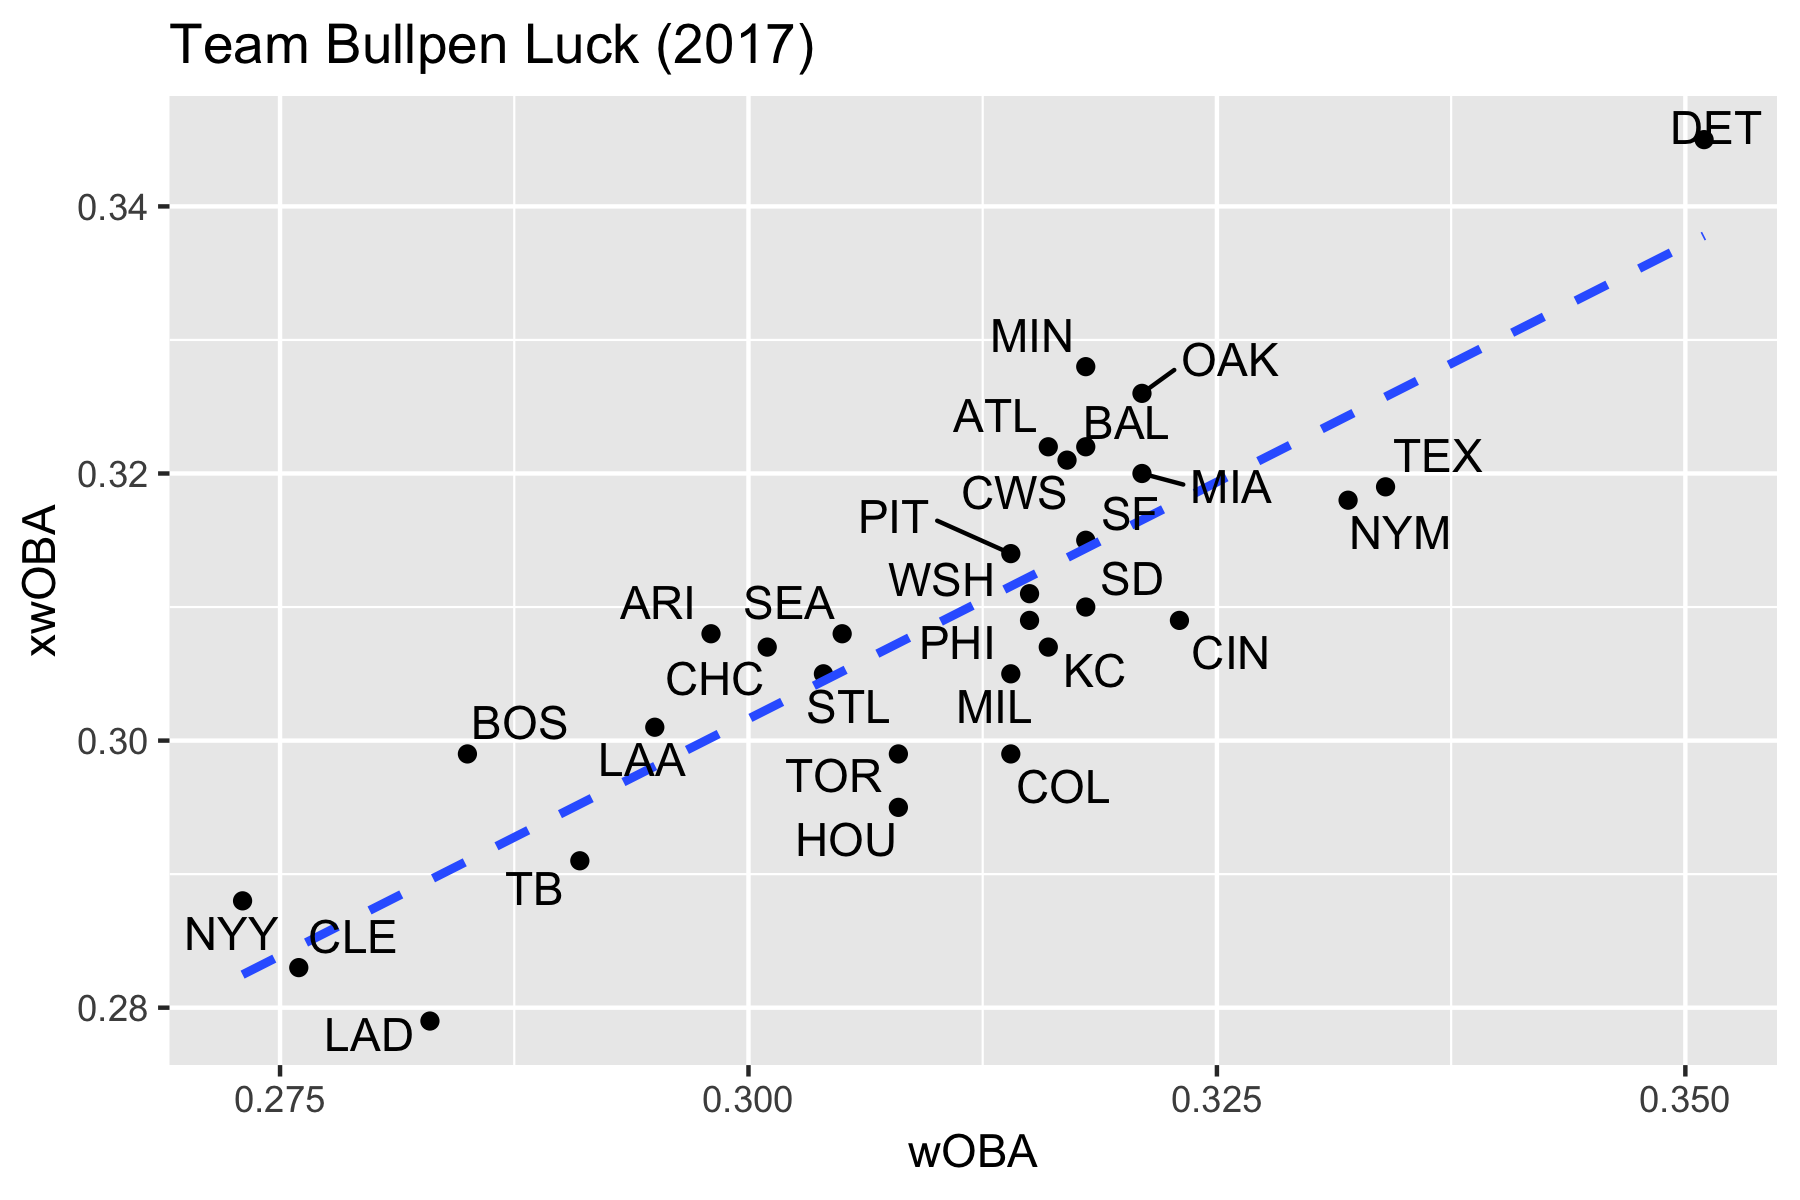
First, we’ll compare how each team’s bullpen performed last year with how one would expect them to perform based on batted ball data. If a team lies above the line, then their actual results were not as bad as one would expect, and they were lucky. The farther below the line, the more unlucky a team was. For instance, in 2017, the Tigers’ bullpen was very bad but also lucky (they should have been worse), while the Dodgers’ bullpen was not only very good but also unlucky (they should have performed even better).
This is the same chart, but with 2018 data instead:
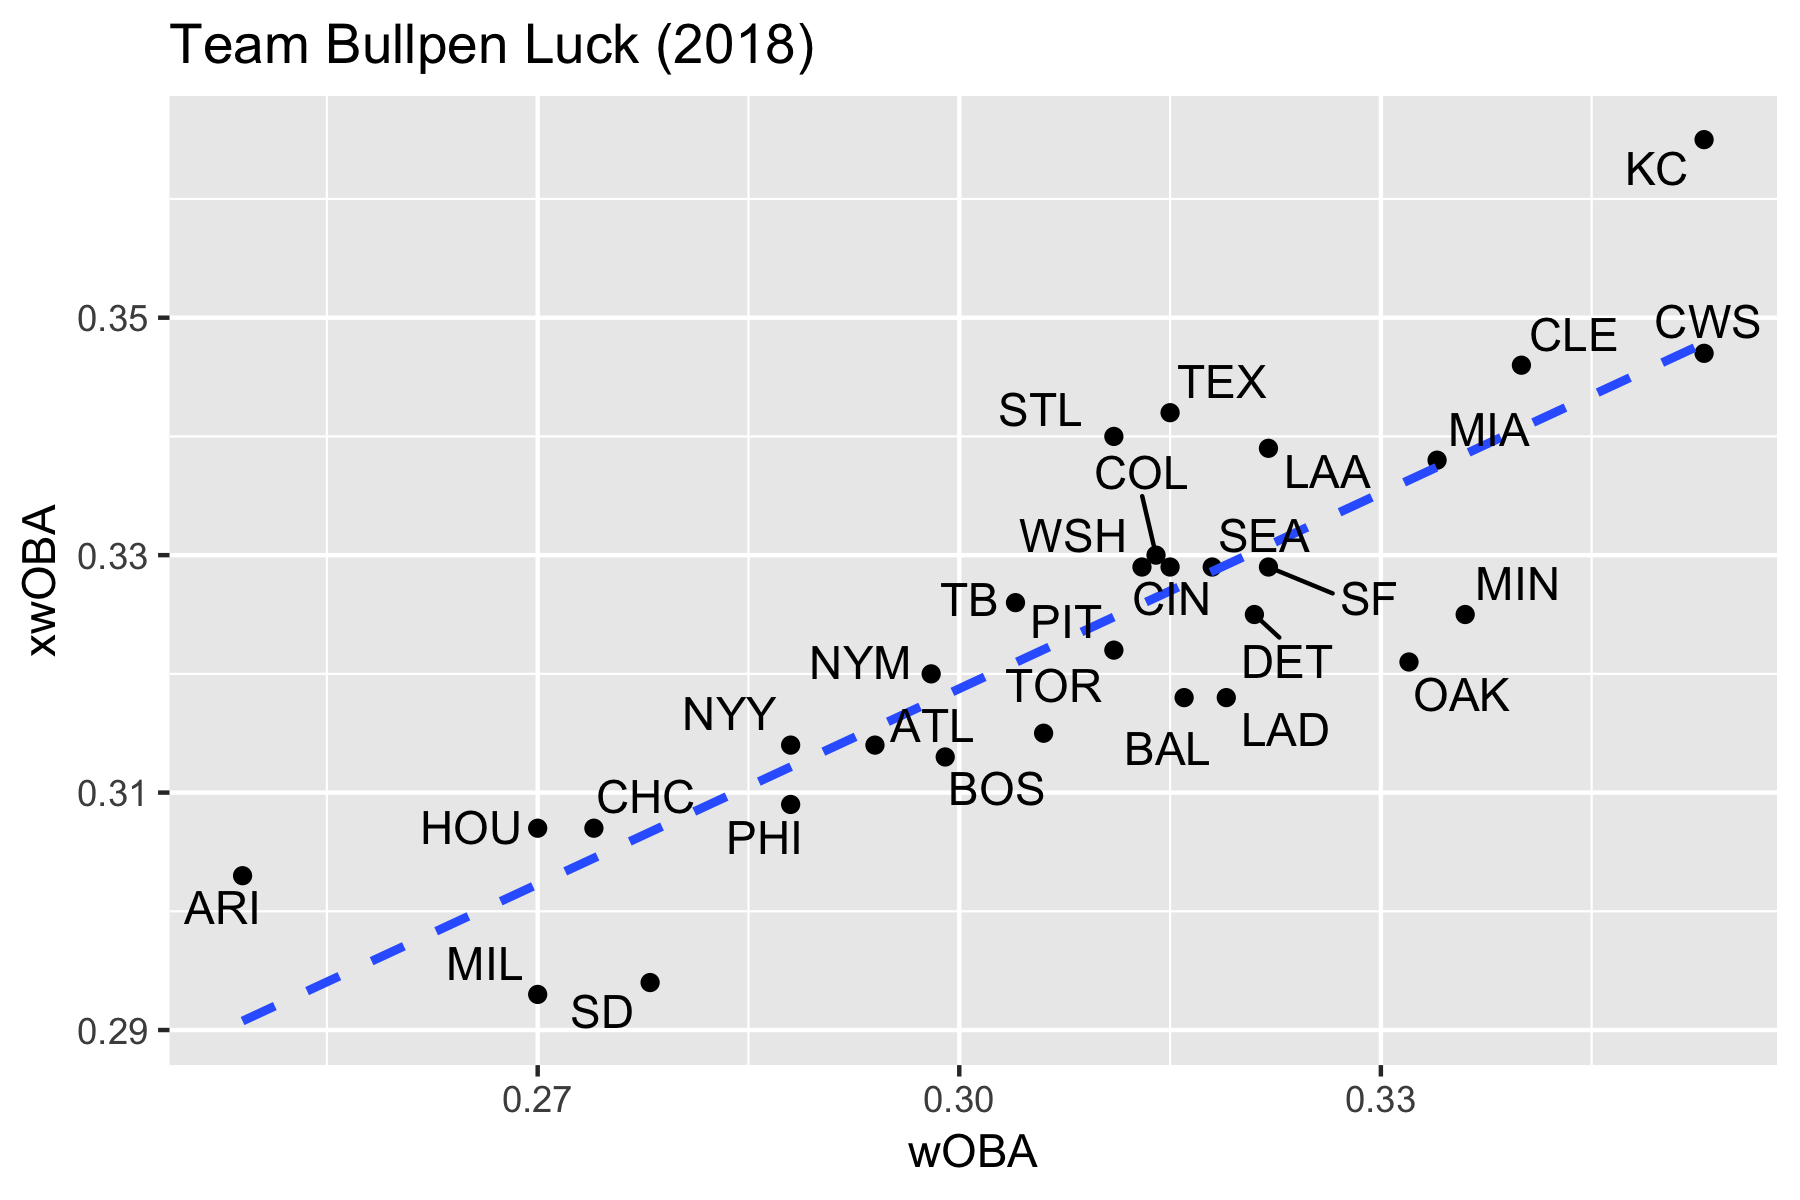
The Diamondbacks’ bullpen has been great, but they’ve been a little lucky. As good as the Brewers’ bullpen has been (led by Josh Hader), one would expect them to be even better. As we would expect, one can see on these two graphs that wOBA and xwOBA are strongly correlated.
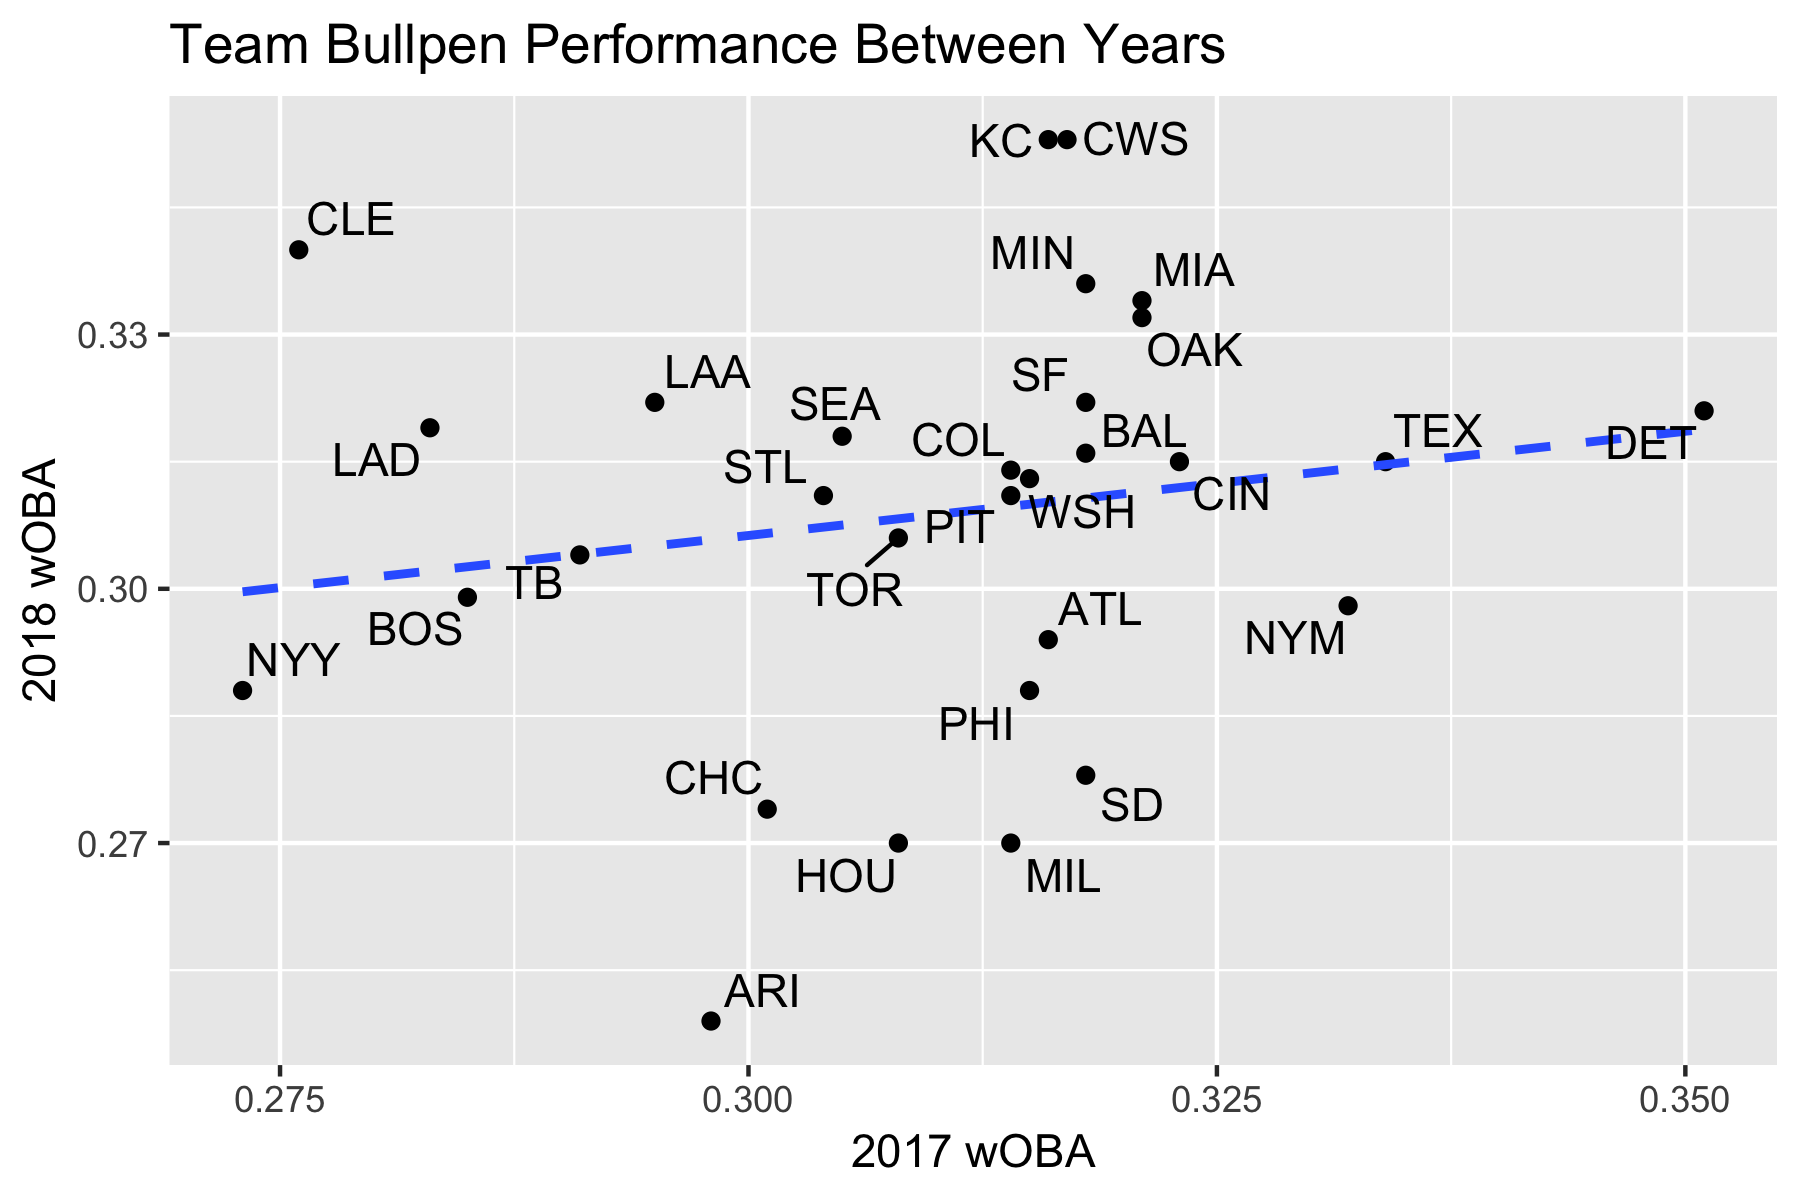
First, we’ll start with actual results. The Diamondbacks’ bullpen is the most improved by wOBA allowed, improving by nearly 0.05 points, while the Indians’ bullpen is worse by a large margin, allowing a wOBA 0.06 points higher than in 2017 so far. In terms of actual results, the Rockies’ bullpen has been exactly the same despite their large investments over the offseason.
| Team | 2017 wOBA | 2018 wOBA | wOBA Diff |
|---|---|---|---|
| ARI | 0.298 | 0.249 | -0.049 |
| MIL | 0.314 | 0.270 | -0.044 |
| SD | 0.318 | 0.278 | -0.040 |
| HOU | 0.308 | 0.270 | -0.038 |
| NYM | 0.332 | 0.298 | -0.034 |
| DET | 0.351 | 0.321 | -0.030 |
| PHI | 0.315 | 0.288 | -0.027 |
| CHC | 0.301 | 0.274 | -0.027 |
| ATL | 0.316 | 0.294 | -0.022 |
| TEX | 0.334 | 0.315 | -0.019 |
| CIN | 0.323 | 0.315 | -0.008 |
| PIT | 0.314 | 0.311 | -0.003 |
| TOR | 0.308 | 0.306 | -0.002 |
| WSH | 0.315 | 0.313 | -0.002 |
| BAL | 0.318 | 0.316 | -0.002 |
| COL | 0.314 | 0.314 | 0.000 |
| SF | 0.318 | 0.322 | 0.004 |
| STL | 0.304 | 0.311 | 0.007 |
| OAK | 0.321 | 0.332 | 0.011 |
| MIA | 0.321 | 0.334 | 0.013 |
| TB | 0.291 | 0.304 | 0.013 |
| SEA | 0.305 | 0.318 | 0.013 |
| BOS | 0.285 | 0.299 | 0.014 |
| NYY | 0.273 | 0.288 | 0.015 |
| MIN | 0.318 | 0.336 | 0.018 |
| LAA | 0.295 | 0.322 | 0.027 |
| CWS | 0.317 | 0.353 | 0.036 |
| LAD | 0.283 | 0.319 | 0.036 |
| KC | 0.316 | 0.353 | 0.037 |
| CLE | 0.276 | 0.340 | 0.064 |
However, actual results don’t tell the story. We can also look at the results each bullpen should expect given the data on batted balls allowed.
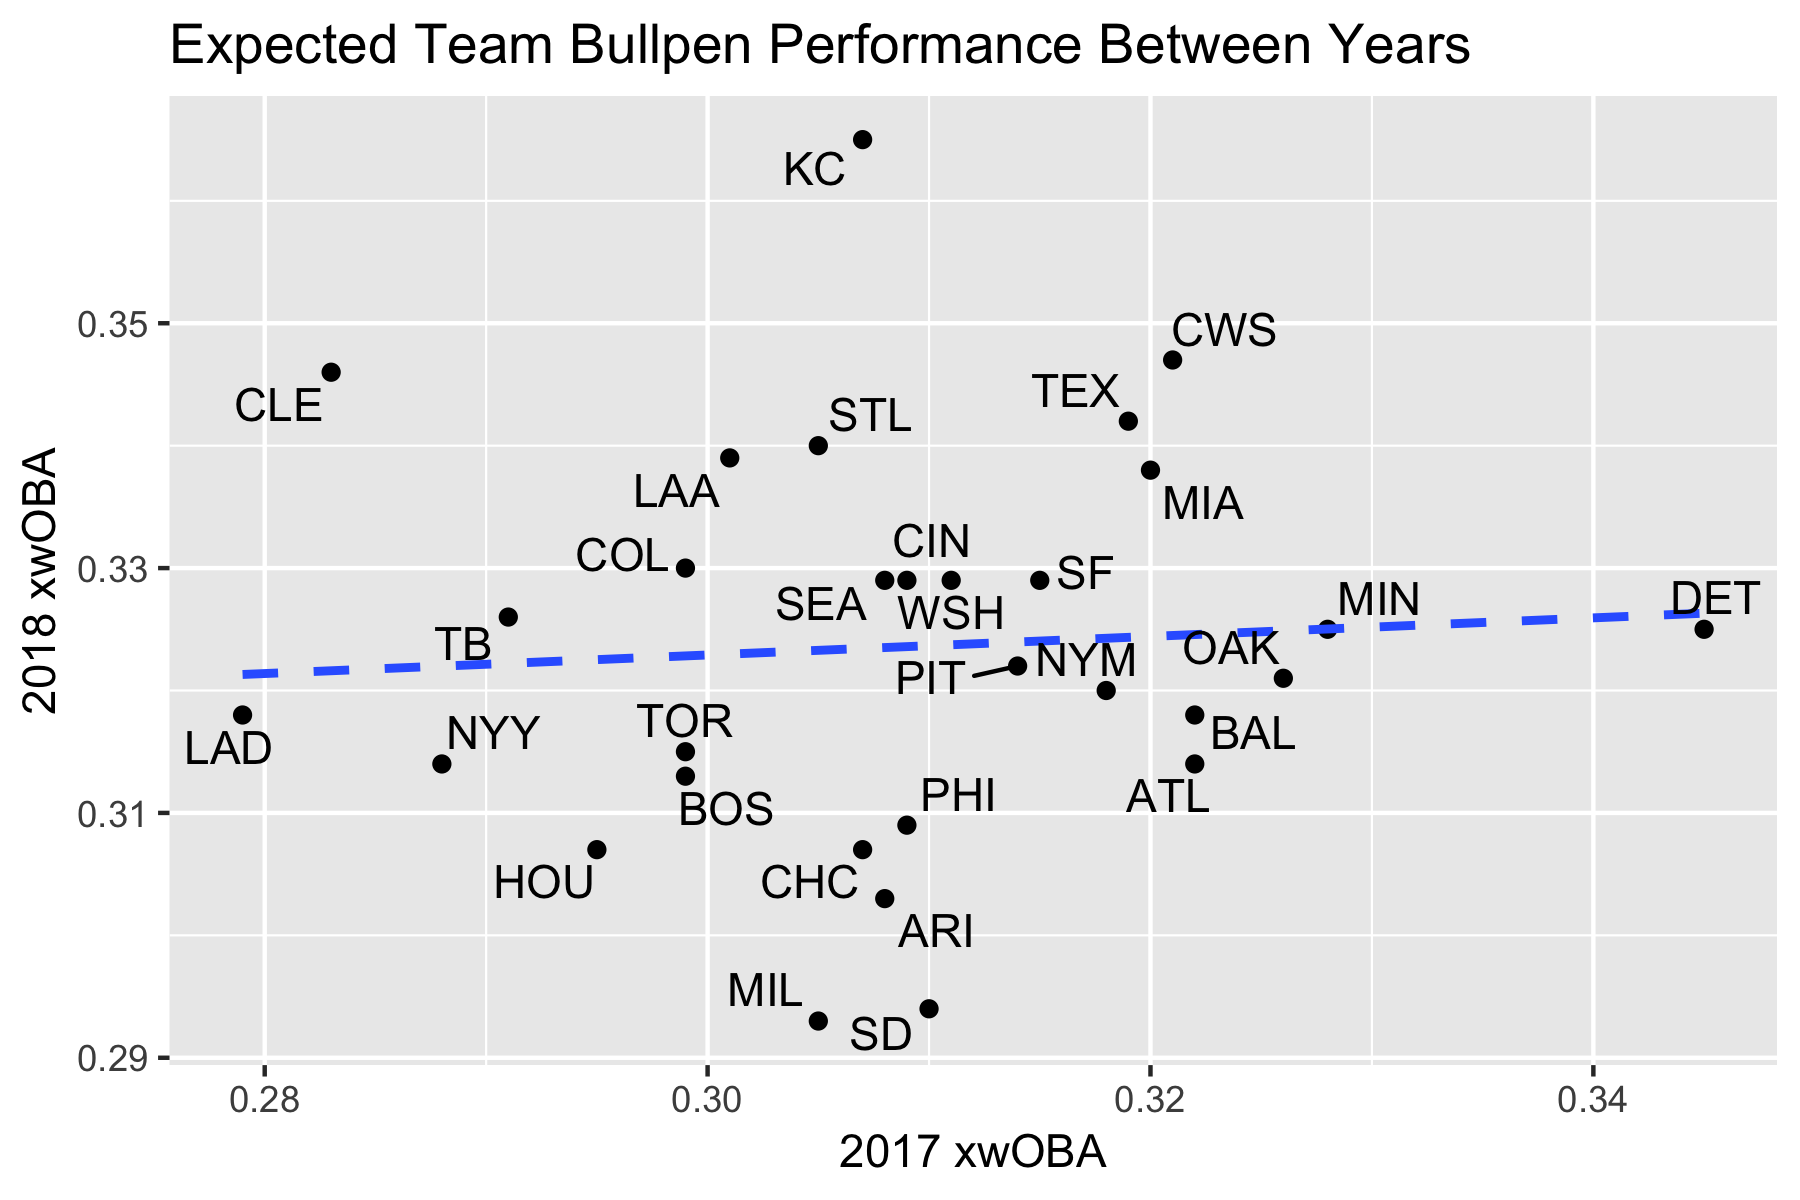
Here, we can see that the Rockies’ bullpen has actually been worse than last year in terms of expected results. There is very little correlation between either actual or expected bullpen results from year to year.
| Team | 2017 xwOBA | 2018 xwOBA | xwOBA Diff |
|---|---|---|---|
| DET | 0.345 | 0.325 | -0.020 |
| SD | 0.310 | 0.294 | -0.016 |
| MIL | 0.305 | 0.293 | -0.012 |
| ATL | 0.322 | 0.314 | -0.008 |
| OAK | 0.326 | 0.321 | -0.005 |
| ARI | 0.308 | 0.303 | -0.005 |
| BAL | 0.322 | 0.318 | -0.004 |
| MIN | 0.328 | 0.325 | -0.003 |
| PHI | 0.309 | 0.309 | 0.000 |
| CHC | 0.307 | 0.307 | 0.000 |
| NYM | 0.318 | 0.320 | 0.002 |
| PIT | 0.314 | 0.322 | 0.008 |
| HOU | 0.295 | 0.307 | 0.012 |
| SF | 0.315 | 0.329 | 0.014 |
| BOS | 0.299 | 0.313 | 0.014 |
| TOR | 0.299 | 0.315 | 0.016 |
| WSH | 0.311 | 0.329 | 0.018 |
| MIA | 0.320 | 0.338 | 0.018 |
| CIN | 0.309 | 0.329 | 0.020 |
| SEA | 0.308 | 0.329 | 0.021 |
| TEX | 0.319 | 0.342 | 0.023 |
| CWS | 0.321 | 0.347 | 0.026 |
| NYY | 0.288 | 0.314 | 0.026 |
| COL | 0.299 | 0.330 | 0.031 |
| TB | 0.291 | 0.326 | 0.035 |
| STL | 0.305 | 0.340 | 0.035 |
| LAA | 0.301 | 0.339 | 0.038 |
| LAD | 0.279 | 0.318 | 0.039 |
| KC | 0.307 | 0.365 | 0.058 |
| CLE | 0.283 | 0.346 | 0.063 |
Finally, here’s a table that shows how each team’s bullpen “luck” has changed year to year, where “luck” is defined as xwOBA-wOBA. The one that stands out the most is the Diamondbacks. Luck is also unsurprisingly inconsistent year-to-year.
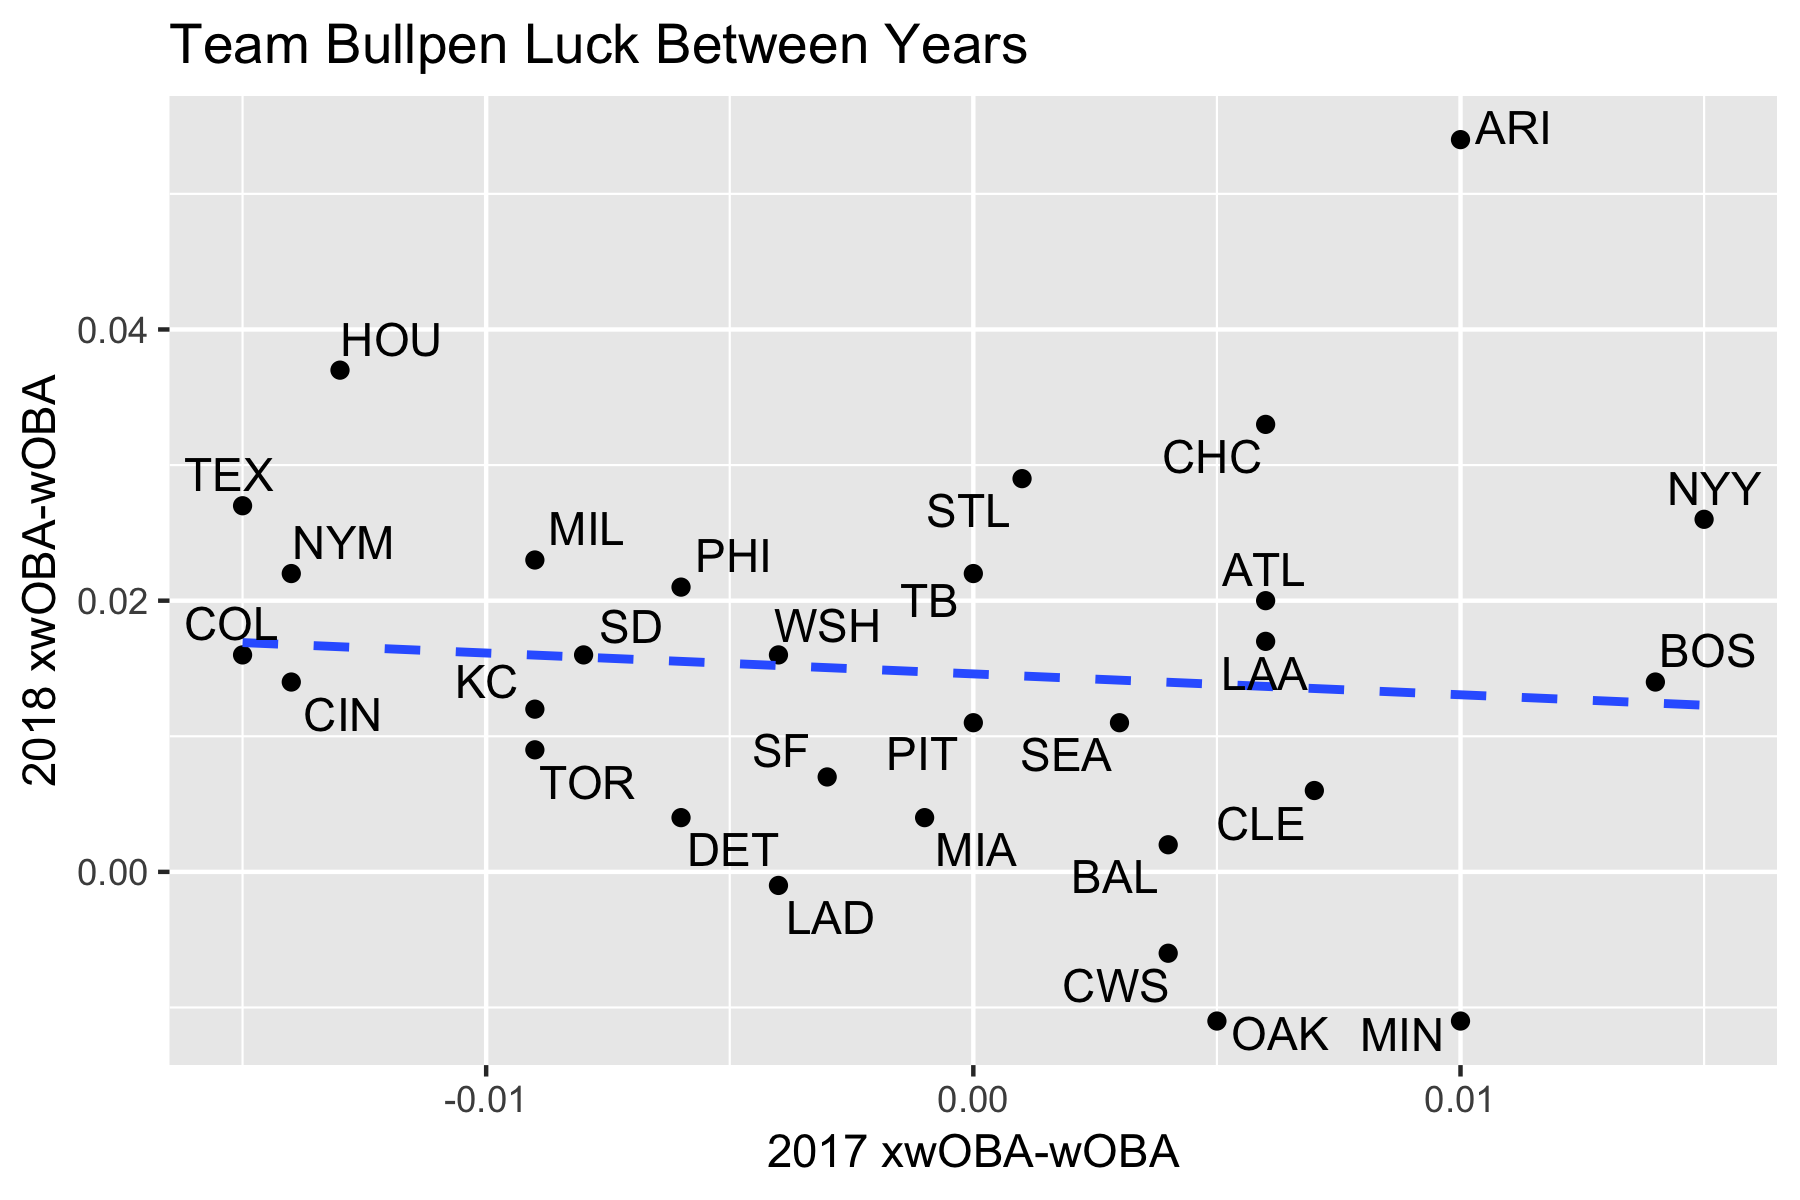
| Team | 2017 Luck | 2018 Luck | Luck Diff |
|---|---|---|---|
| MIN | 0.010 | -0.011 | -0.021 |
| OAK | 0.005 | -0.011 | -0.016 |
| CWS | 0.004 | -0.006 | -0.010 |
| BAL | 0.004 | 0.002 | -0.002 |
| CLE | 0.007 | 0.006 | -0.001 |
| BOS | 0.014 | 0.014 | 0.000 |
| LAD | -0.004 | -0.001 | 0.003 |
| MIA | -0.001 | 0.004 | 0.005 |
| SEA | 0.003 | 0.011 | 0.008 |
| DET | -0.006 | 0.004 | 0.010 |
| SF | -0.003 | 0.007 | 0.010 |
| PIT | 0.000 | 0.011 | 0.011 |
| LAA | 0.006 | 0.017 | 0.011 |
| NYY | 0.015 | 0.026 | 0.011 |
| ATL | 0.006 | 0.020 | 0.014 |
| TOR | -0.009 | 0.009 | 0.018 |
| WSH | -0.004 | 0.016 | 0.020 |
| KC | -0.009 | 0.012 | 0.021 |
| TB | 0.000 | 0.022 | 0.022 |
| SD | -0.008 | 0.016 | 0.024 |
| CHC | 0.006 | 0.033 | 0.027 |
| PHI | -0.006 | 0.021 | 0.027 |
| CIN | -0.014 | 0.014 | 0.028 |
| STL | 0.001 | 0.029 | 0.028 |
| COL | -0.015 | 0.016 | 0.031 |
| MIL | -0.009 | 0.023 | 0.032 |
| NYM | -0.014 | 0.022 | 0.036 |
| TEX | -0.015 | 0.027 | 0.042 |
| ARI | 0.010 | 0.054 | 0.044 |
| HOU | -0.013 | 0.037 | 0.050 |
On the whole, xwOBA is up this year (by a mean of 0.0148), but wOBA is down very slightly (by a mean of -0.0013). This gap will probably decrease as luck evens out and the weather continues to get better over the course of the season.