Tracing Starter Performance by Inning
In an attempt to sharpen my data visualization skills, I decided to look at some of the top starters from the 2016 season by inning. The pitchers were selected by a combination of innings pitched, complete games, and personal preference. Each pitcher pitched at least 150 innings last season. One thing to keep in mind with all of these is that as the game goes on the sample size decreases. Starters rarely made it through the ninth inning this season, so later game results should be taken with a grain of salt. This type of analysis is best for getting a broad idea of a pitcher.1
The x-axis for each of these graphs is innings. The y-axis varies based on the metric being measured.
Velocity
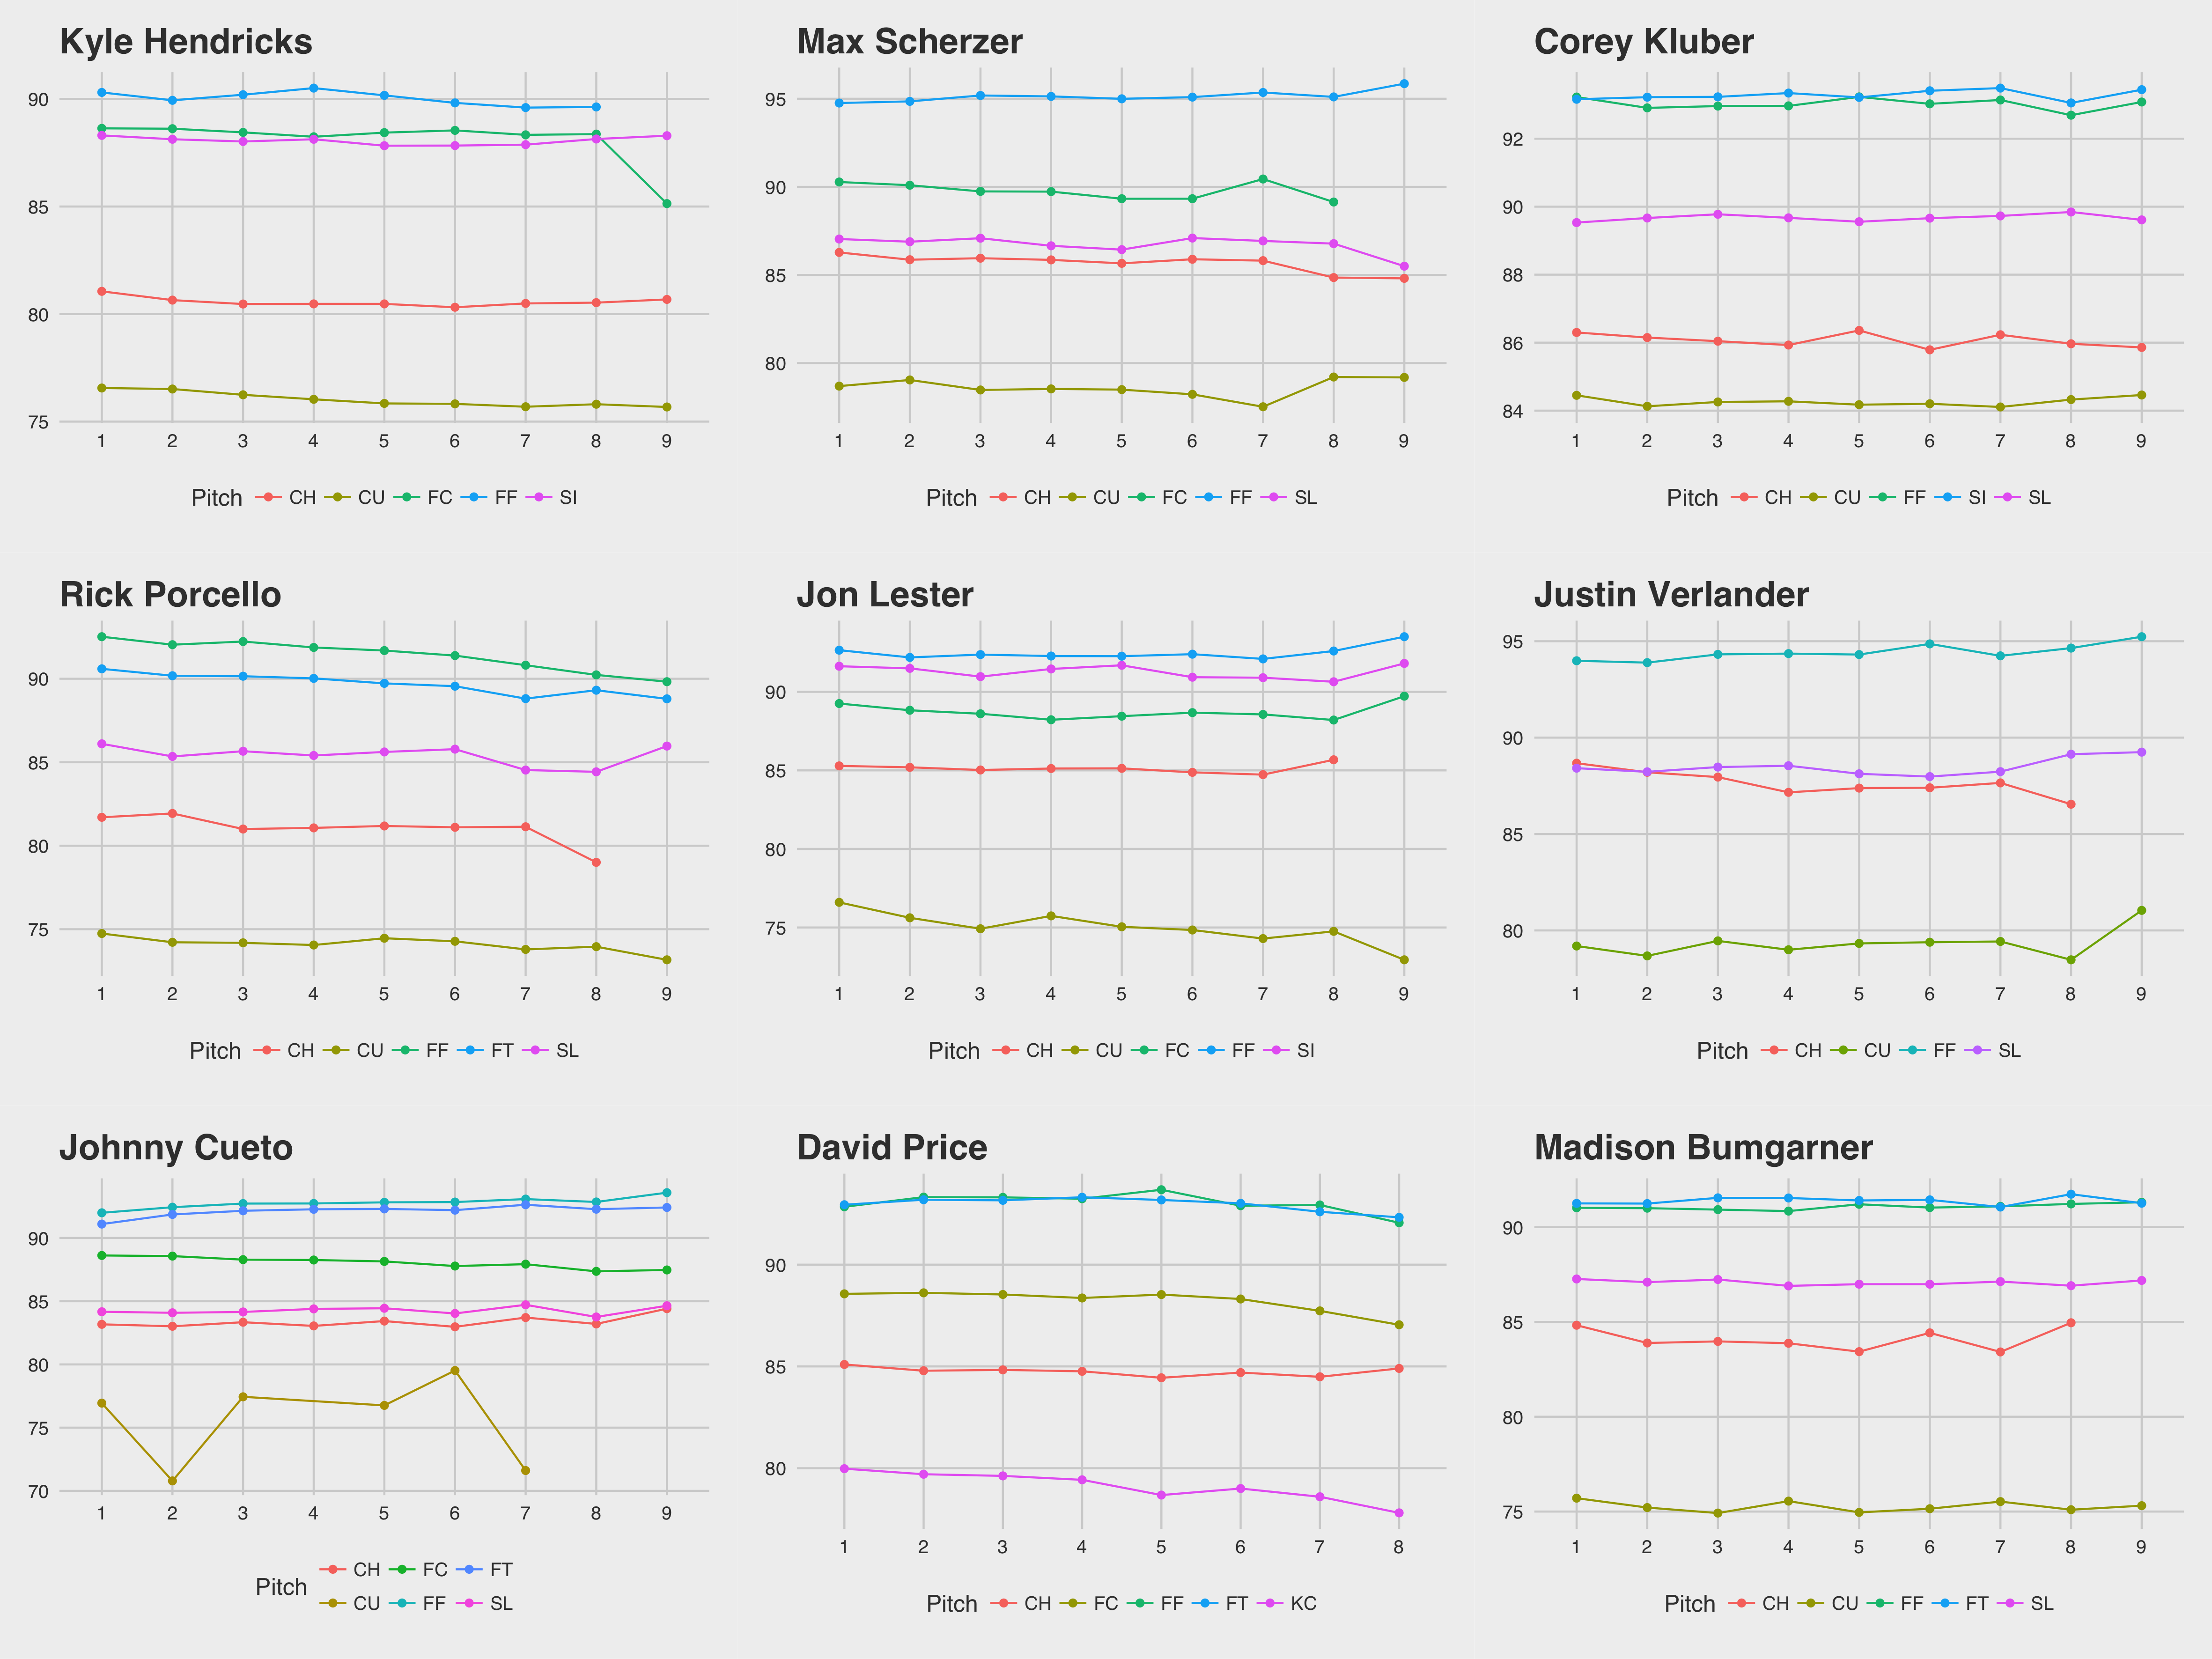
Every pitcher except Scherzer and Verlander (both past Tigers, coincidentally) featured 2-3 pitches that had very similar velocity at the top of the charts. All the pitchers featured a curveball of some sort that averaged below 80 mph except Kluber whose averaged 84+ mph.
Spin
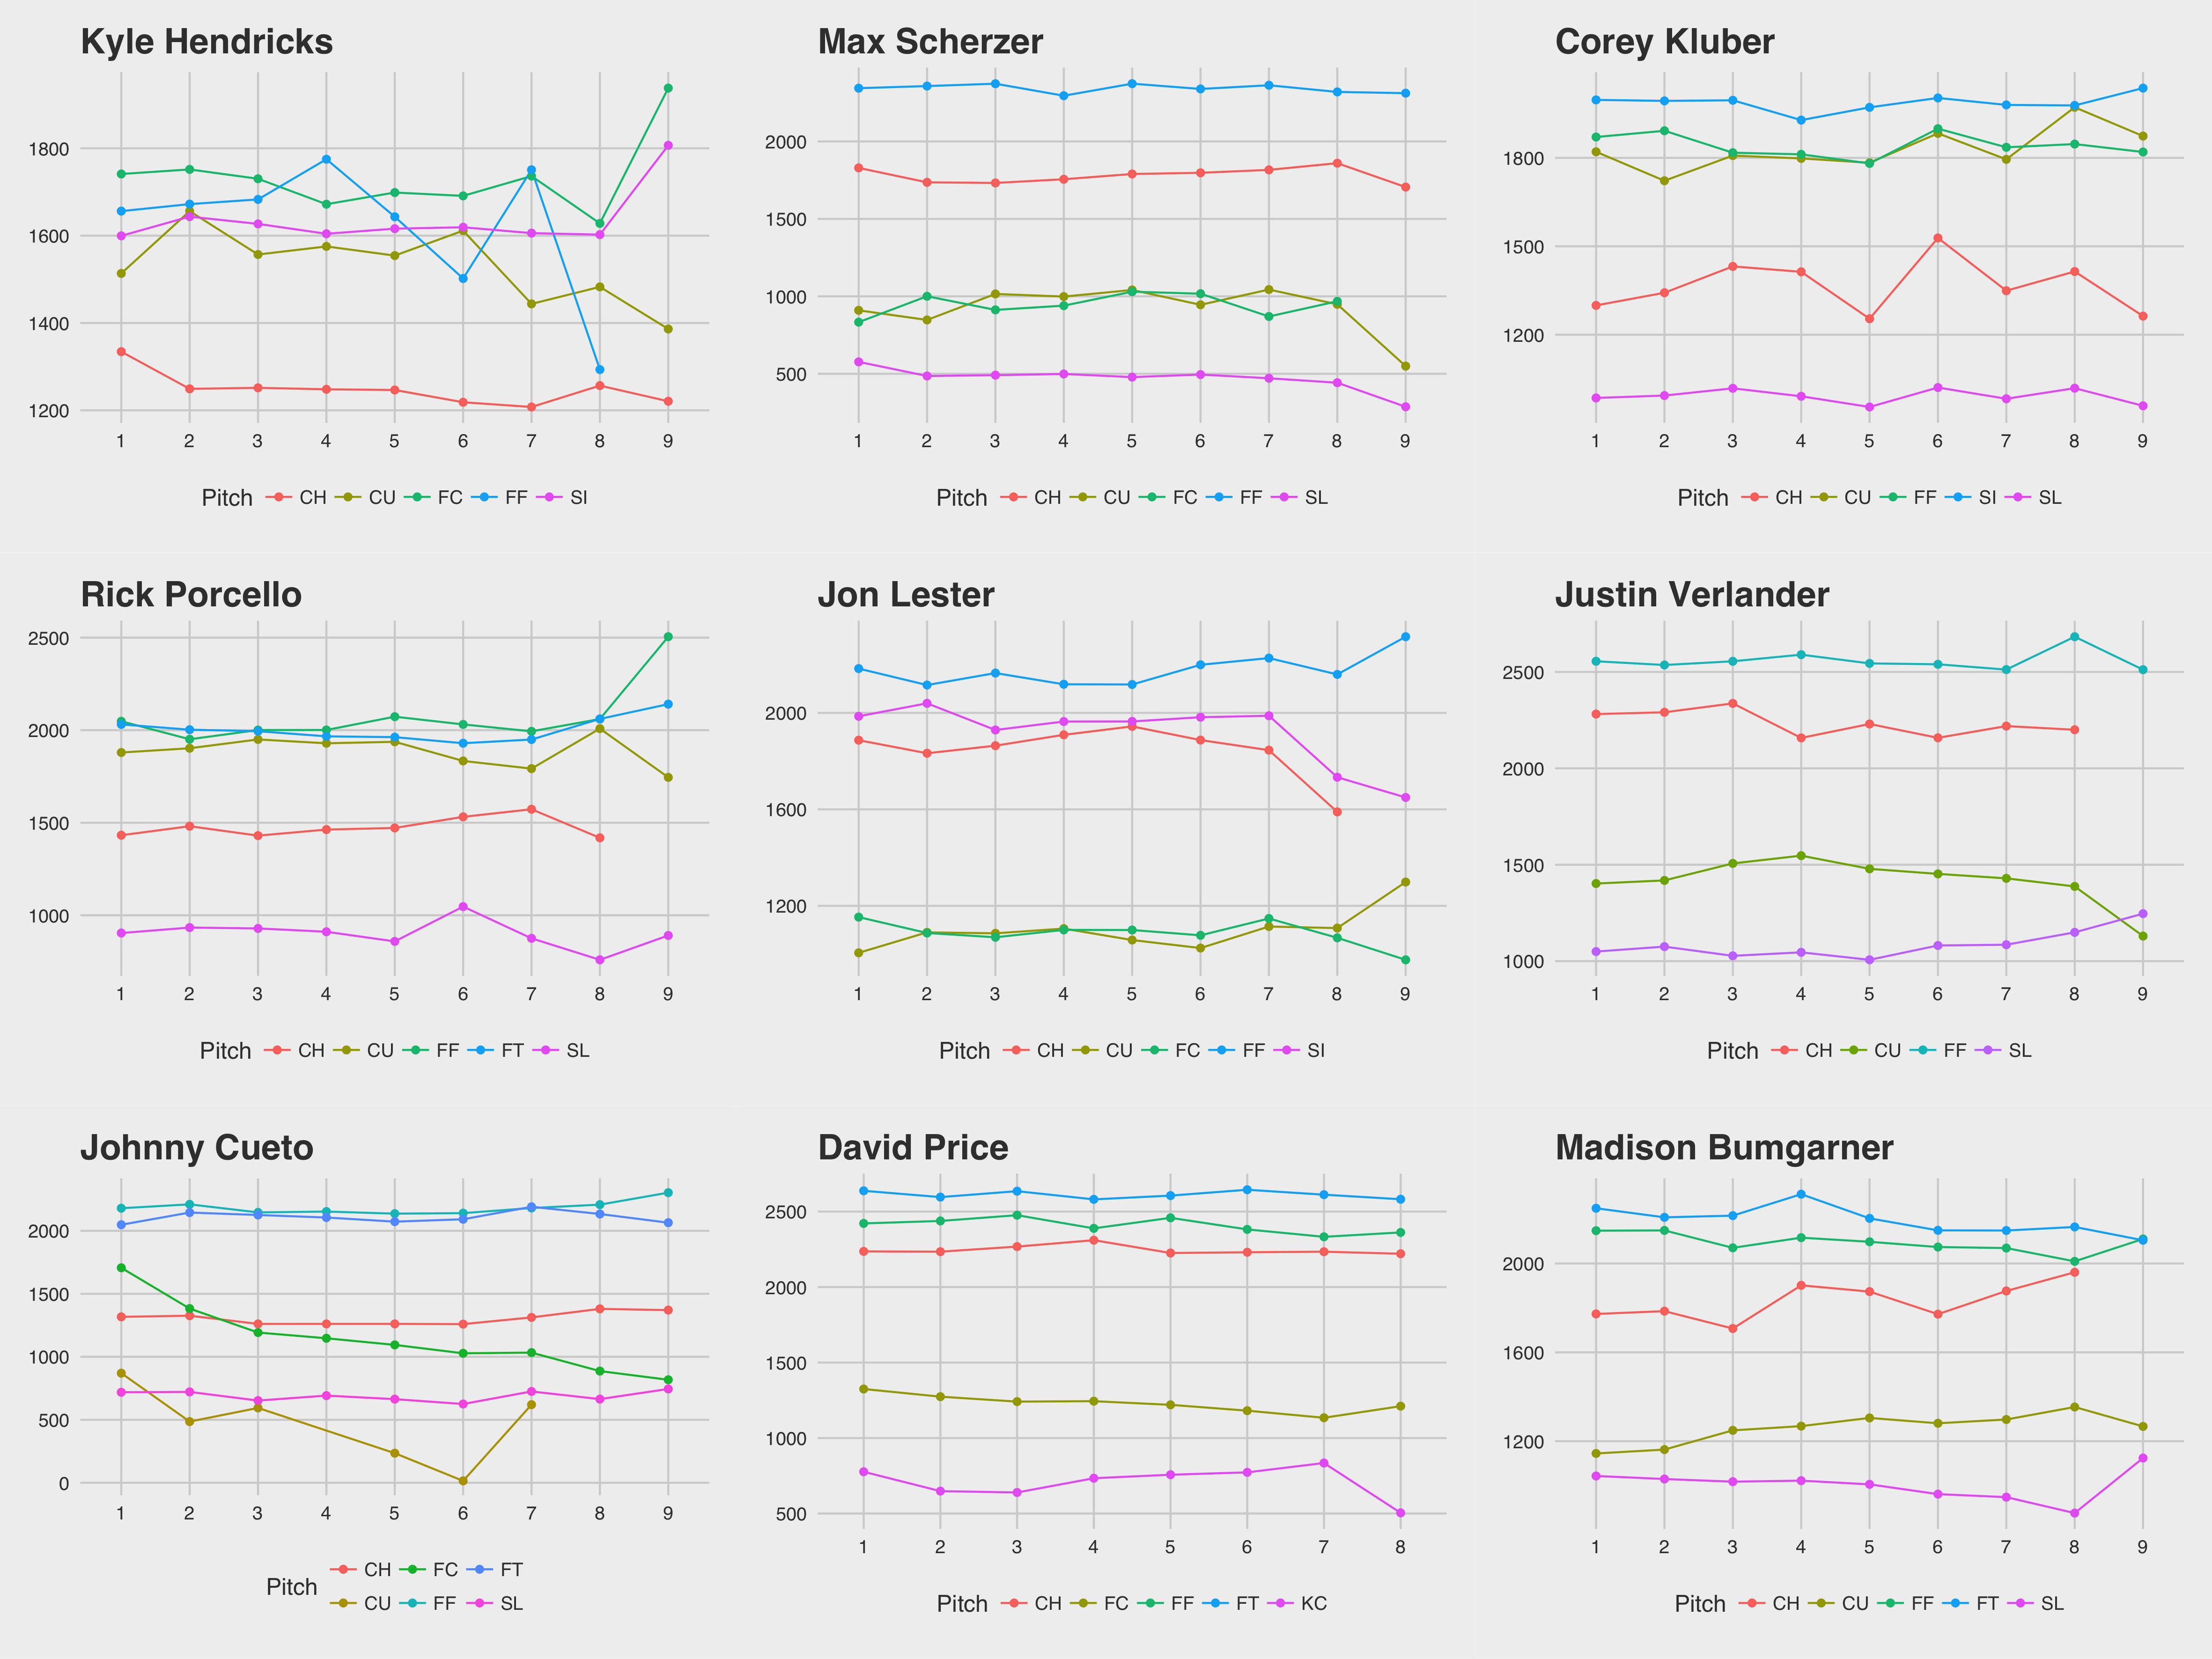
Kyle Hendricks’ spin rate varies wildly from inning to inning. His pitches are grouped closer together, which plays into his strategy of deceiving hitters with consistency until it’s too late. Hendricks also has one of the lower average spin rates, with only Kluber’s chart having the same axis. In contrast, David Price throws three pitches that all had an average spin rate of over 2000 throughout the entire game. Max Scherzer’s slider, on the other hand, spun around 1/4th as much on average.
Break
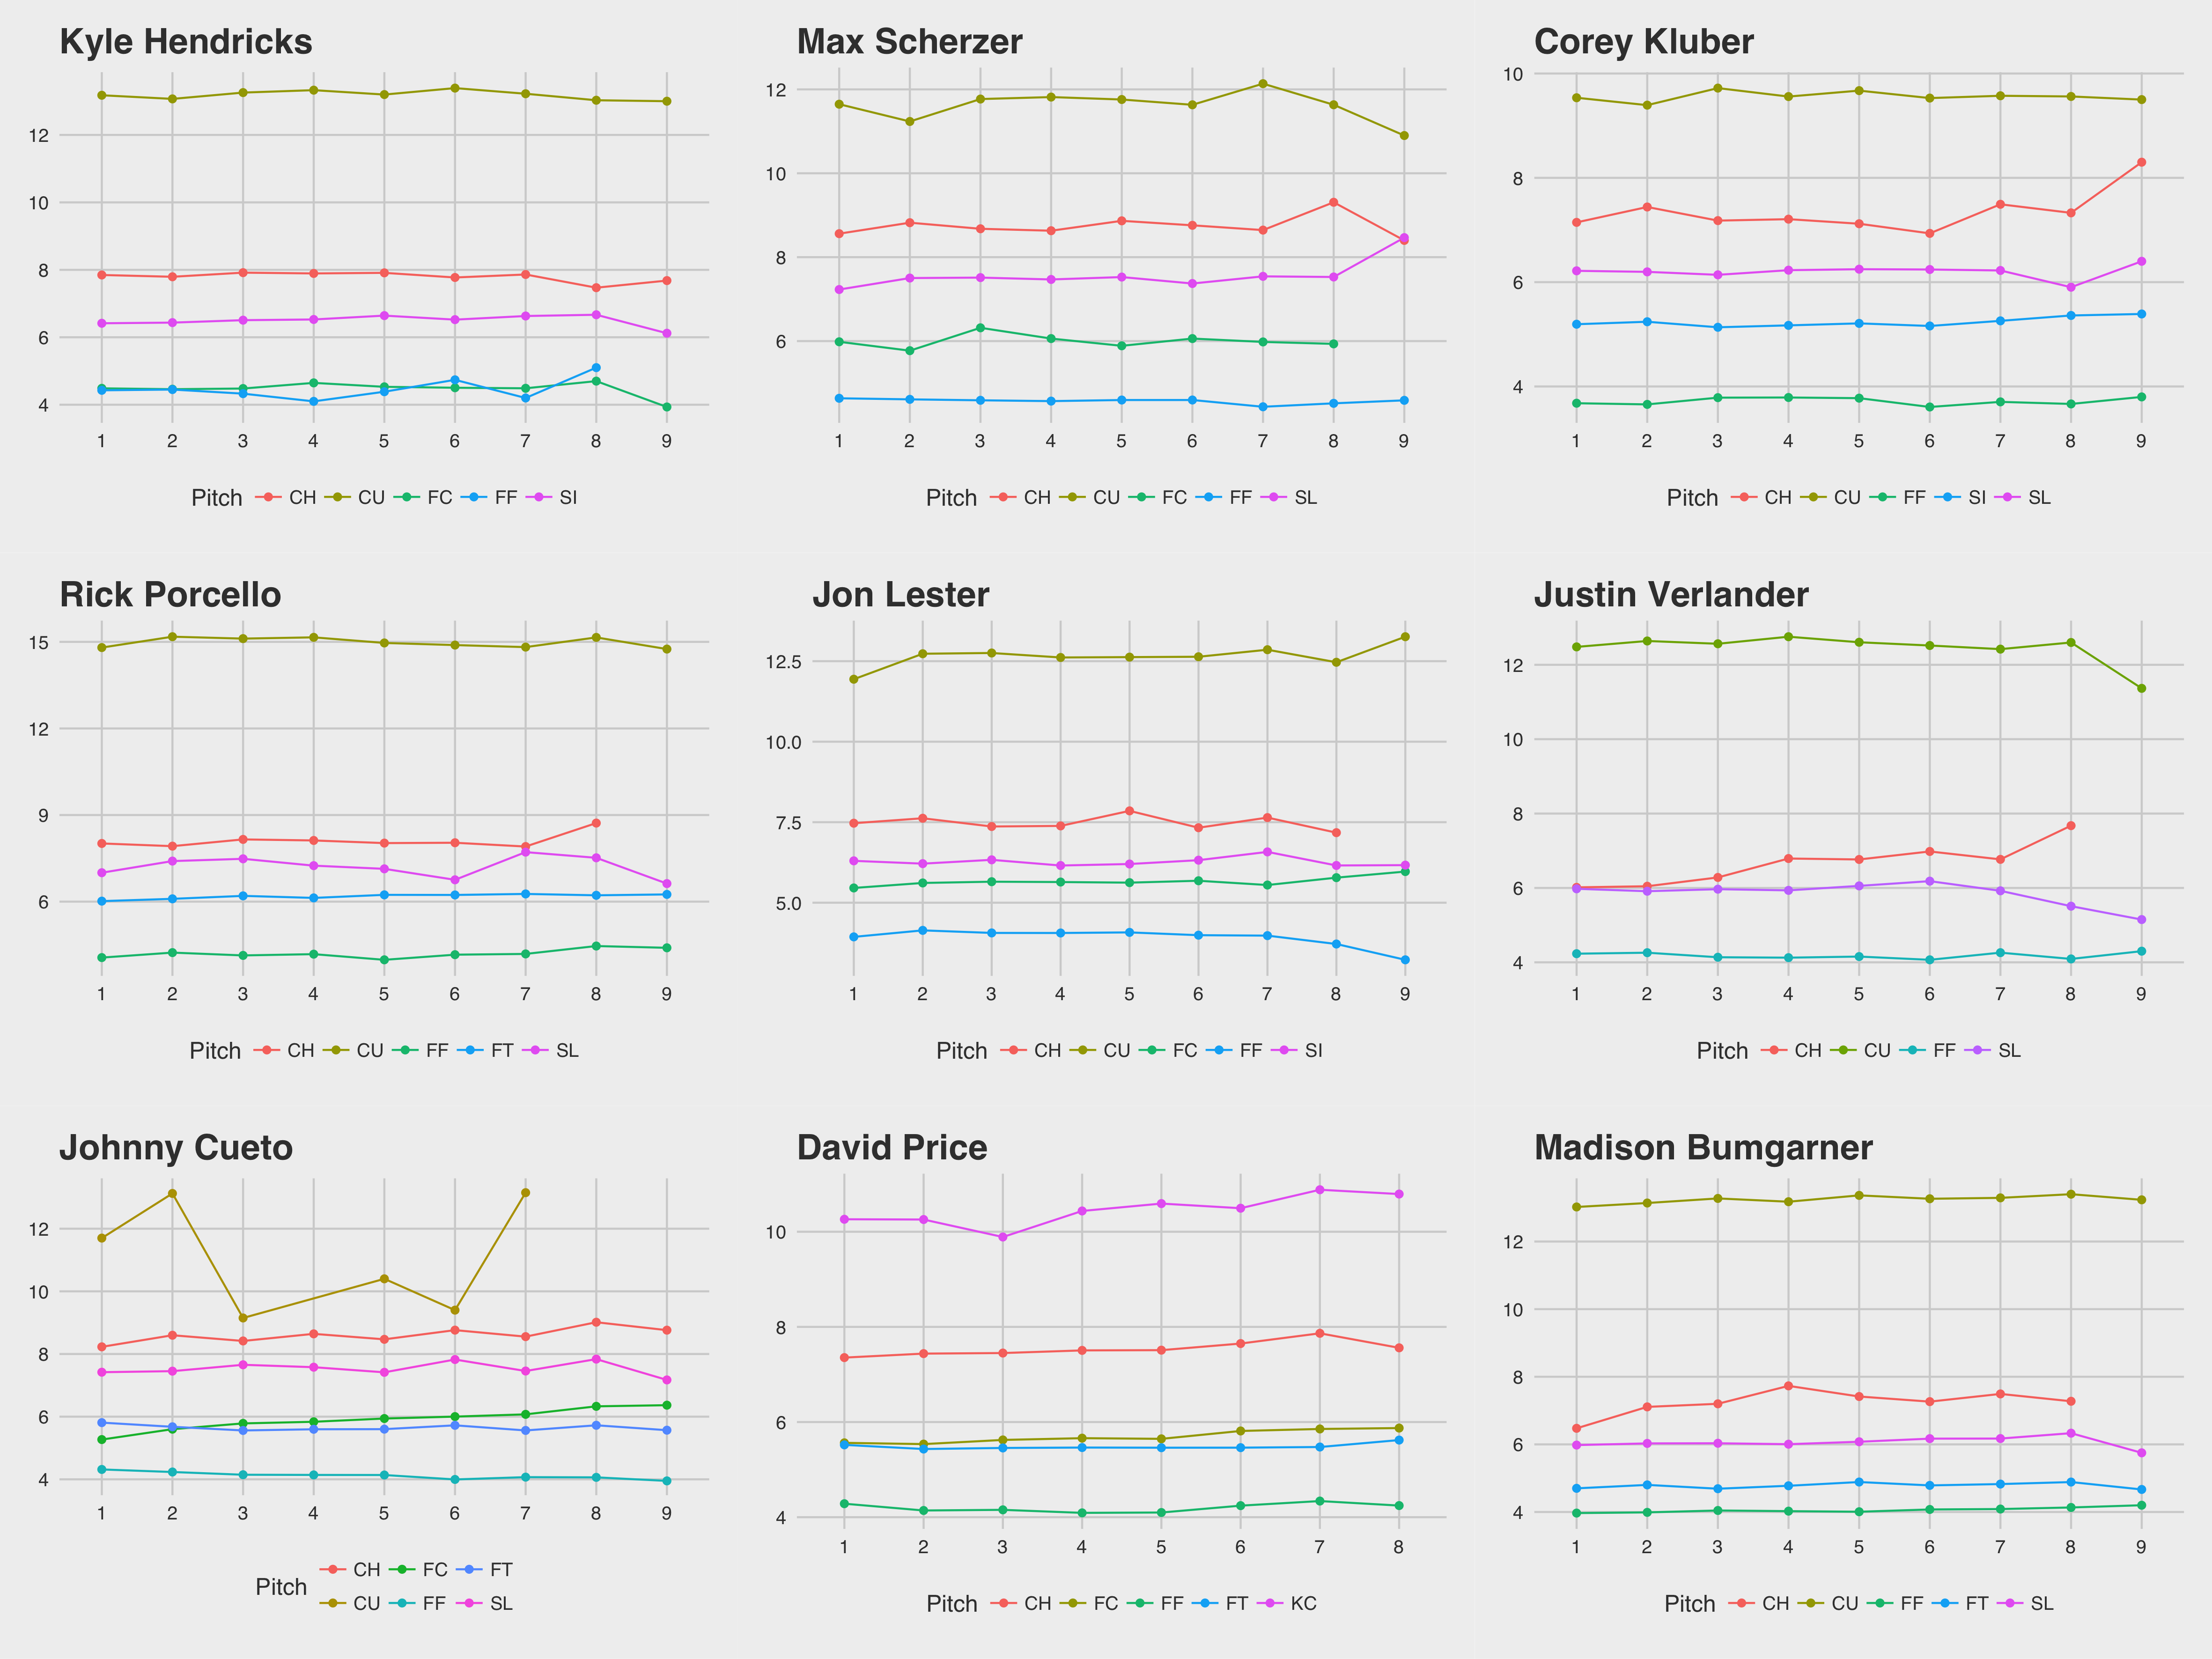
Curveballs tend to have the greatest average break, followed by changeups, sliders, and sinkers, with cutters and two- and four-seam fastballs at the bottom. Curveball break tends to go down in the ninth inning. Even Rick Porcello’s break takes a very slight downturn then, despite it having the highest break by far.
In terms of more general observations, check out Johnny Cueto’s remarkably inconsistent curveball. The pitch varies the most in all three metrics inning-to-inning, and he didn’t throw it past the seventh inning. Of course, he only threw it 11 times all season, and only twice in a day once. He never threw it with a runner on base, and preferred to throw it with nobody out. The pitch had pretty good results: five balls, three called strikes, one swinging strike, a groundout and a popout.