Carl Edwards Had a Bad Day in a Great Year
This post was featured on the Fangraphs community blog here
This week I played around with the baseballr package, which provides easy access to FanGraphs, Baseball Reference, and Statcast data in R1.
I’ve been particularly intrigued recently by Carl Edwards Jr., a Cubs reliever who got called up last season. He had always seemed to be surprisingly good, but I wasn’t aware quite how good he was until I calculated wOBA allowed by pitchers in 2016 and found that he had the third lowest in the league, behind only Kenley Jansen and Zach Britton, and in front of Clayton Kershaw, Aroldis Chapman, and Andrew Miller. Ranking Edwards among four of the game’s top closers and the game’s best starter seemed strange. Here are the six pitchers with the lowest wOBA-against last season:
| Name | IP | ERA | WHIP | BABIP | FIP | wOBA |
|---|---|---|---|---|---|---|
| Zach Britton | 67.0 | 0.54 | 0.836 | 0.231 | 1.80 | 0.188 |
| Kenley Jansen | 68.2 | 1.83 | 0.670 | 0.244 | 1.34 | 0.188 |
| Carl Edwards | 36.0 | 3.75 | 0.806 | 0.162 | 2.79 | 0.201 |
| Clayton Kershaw | 149.2 | 1.68 | 0.722 | 0.256 | 1.78 | 0.202 |
| Aroldis Chapman | 58.0 | 1.55 | 0.862 | 0.268 | 1.42 | 0.206 |
| Andrew Miller | 74.1 | 1.45 | 0.686 | 0.258 | 1.68 | 0.209 |
Edwards stands out negatively in several respects here. He pitched the least innings out of that group by far, and was almost certainly put in the least stressful situations. His ERA is almost two points higher than the next highest’s, and his FIP is nearly a point higher than Britton’s, the second highest mark. His BABIP is also remarkably low, due in part to luck and in part to the Cubs’ historically good defense. So why is his wOBA so remarkable?
Looking through Edwards’ game log, two bad appearances stand out:
- August 13th, where he allowed five runs on one hit and four walks while recording just two outs.
- September 17th, where he allowed three runs on three hits (two of them home runs) in an inning’s work.
If we remove the August 13th outing, Edwards’ ERA drops to 2.55, almost an entire point. If we remove the September 17th outing as well, it drops to 1.83. Removing the first performance, his FIP drops to 2.56. Removing the other brings it down to 1.96, which is still higher than the other five pitchers (possibly due to his BABIP) but much closer. Bad pitching performances are part of a pitcher’s year, and shouldn’t be entirely disregarded. However, it seems likely that something was off (mechanically, physically, or mentally) on August 13th.
We’ll get back to these games later.
As the Cubs consistently carried three catchers last season, I thought it would be interesting to compare Edwards’ performance across all three:
cej_by_catcher <- cej %>%
  group_by(pitch_type, catcher) %>%
  summarize(n = n(),
            avg_mph = mean(as.numeric(as.character(start_speed)), na.rm = TRUE),
            avg_spin = mean(as.numeric(as.character(spin_rate)), na.rm = TRUE),
            avg_hit_distance = mean(hit_distance_sc, na.rm = TRUE),
            avg_hit_speed = mean(hit_speed, na.rm = TRUE),
            avg_hit_angle = mean(hit_angle, na.rm = TRUE),
            avg_barrel = mean(barrel, na.rm = TRUE),
            avg_ext = mean(release_extension, na.rm = TRUE)) %>%
  mutate(pitch_pct = n/sum(n)) %>%
  filter(pitch_type != "CH", pitch_type != "IN") # These each occur once and may be mistakes
The baseballr package also allows us to look at Statcast data from Baseball Savant:
cej <- scrape_statcast_savant_pitcher(start_date = "2016-04-06", end_date = "2016-10-15", pitcherid = 605218)| type | catcher | count | mph | hit_dist | hit_spd | pct |
|---|---|---|---|---|---|---|
| CU | Ross | 27 | 81.16 | 119 | 73.6 | 16.67% |
| CU | Montero | 53 | 81.54 | 258.8 | 94.86 | 32.72% |
| CU | Federowicz | 3 | 81.25 | NA | NA | 1.85% |
| CU | Contreras | 79 | 81.02 | 208.8 | 87.74 | 48.77% |
| FF | Ross | 99 | 95.72 | 186.8 | 84.31 | 21.57% |
| FF | Montero | 147 | 95.44 | 211.1 | 83.77 | 32.03% |
| FF | Federowicz | 9 | 95.77 | 183 | 95.5 | 1.96% |
| FF | Contreras | 204 | 95.44 | 199.4 | 85.94 | 44.44% |
From the table, we can see that Edwards throws two main pitches—a four-seam fastball and a curveball. He pitched most often to Willson Contreras, then Miguel Montero, then David Ross (and once to Tim Federowicz). Edwards threw his fastball a notch faster to Ross than other catchers, which could be due to the small sample size. He also threw his fastball more to Ross than other catchers: despite throwing 16.67% of his curveballs to Ross, he threw 21.57% of his fastballs to him. There are several reasons this might be the case:
- Edwards focused on his fastball earlier in the season before gaining more confidence in his curve.
- Ross saw that Edwards’ fastball was producing better results and called it more often.
- Contreras was more confident in his agility and therefore ability to block a curveball than Ross was.
- Random sampling and a small sample size.
Let’s take a look at the results these pitches got. By plotting hit velocity and hit distance, we can compare results across catchers:
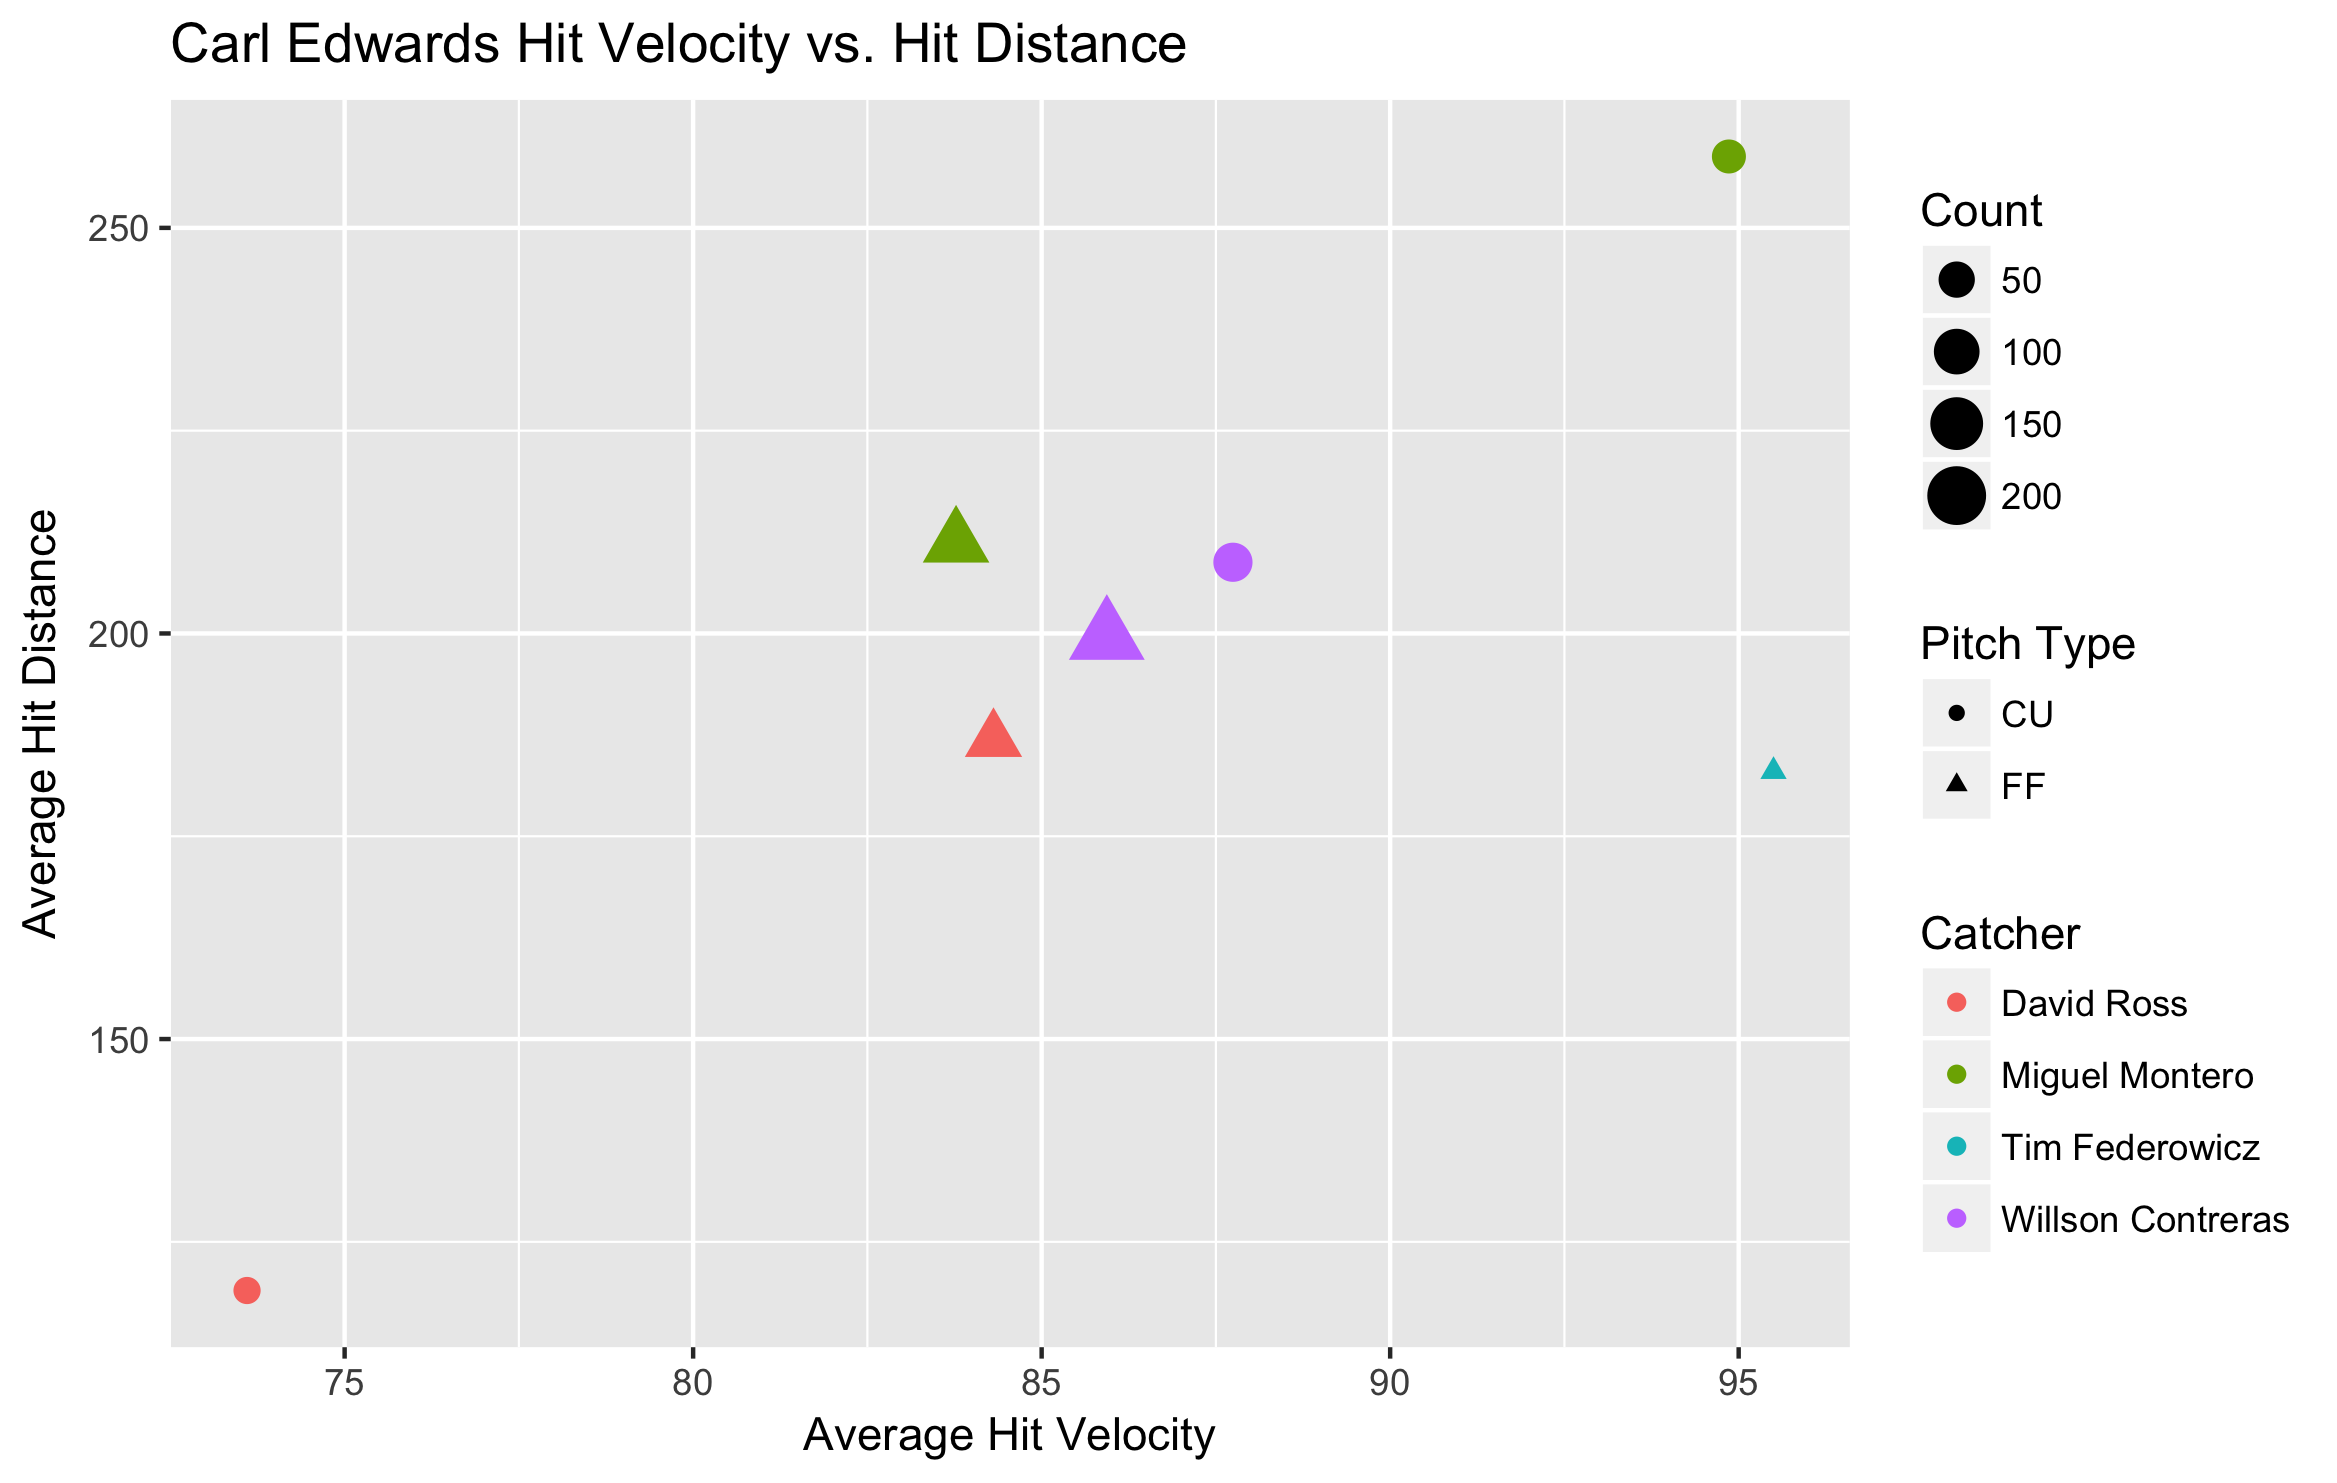
When Ross was catching, Edwards tended to generate softer contact that went shorter distances. We can use the Statcast data to see why that is.
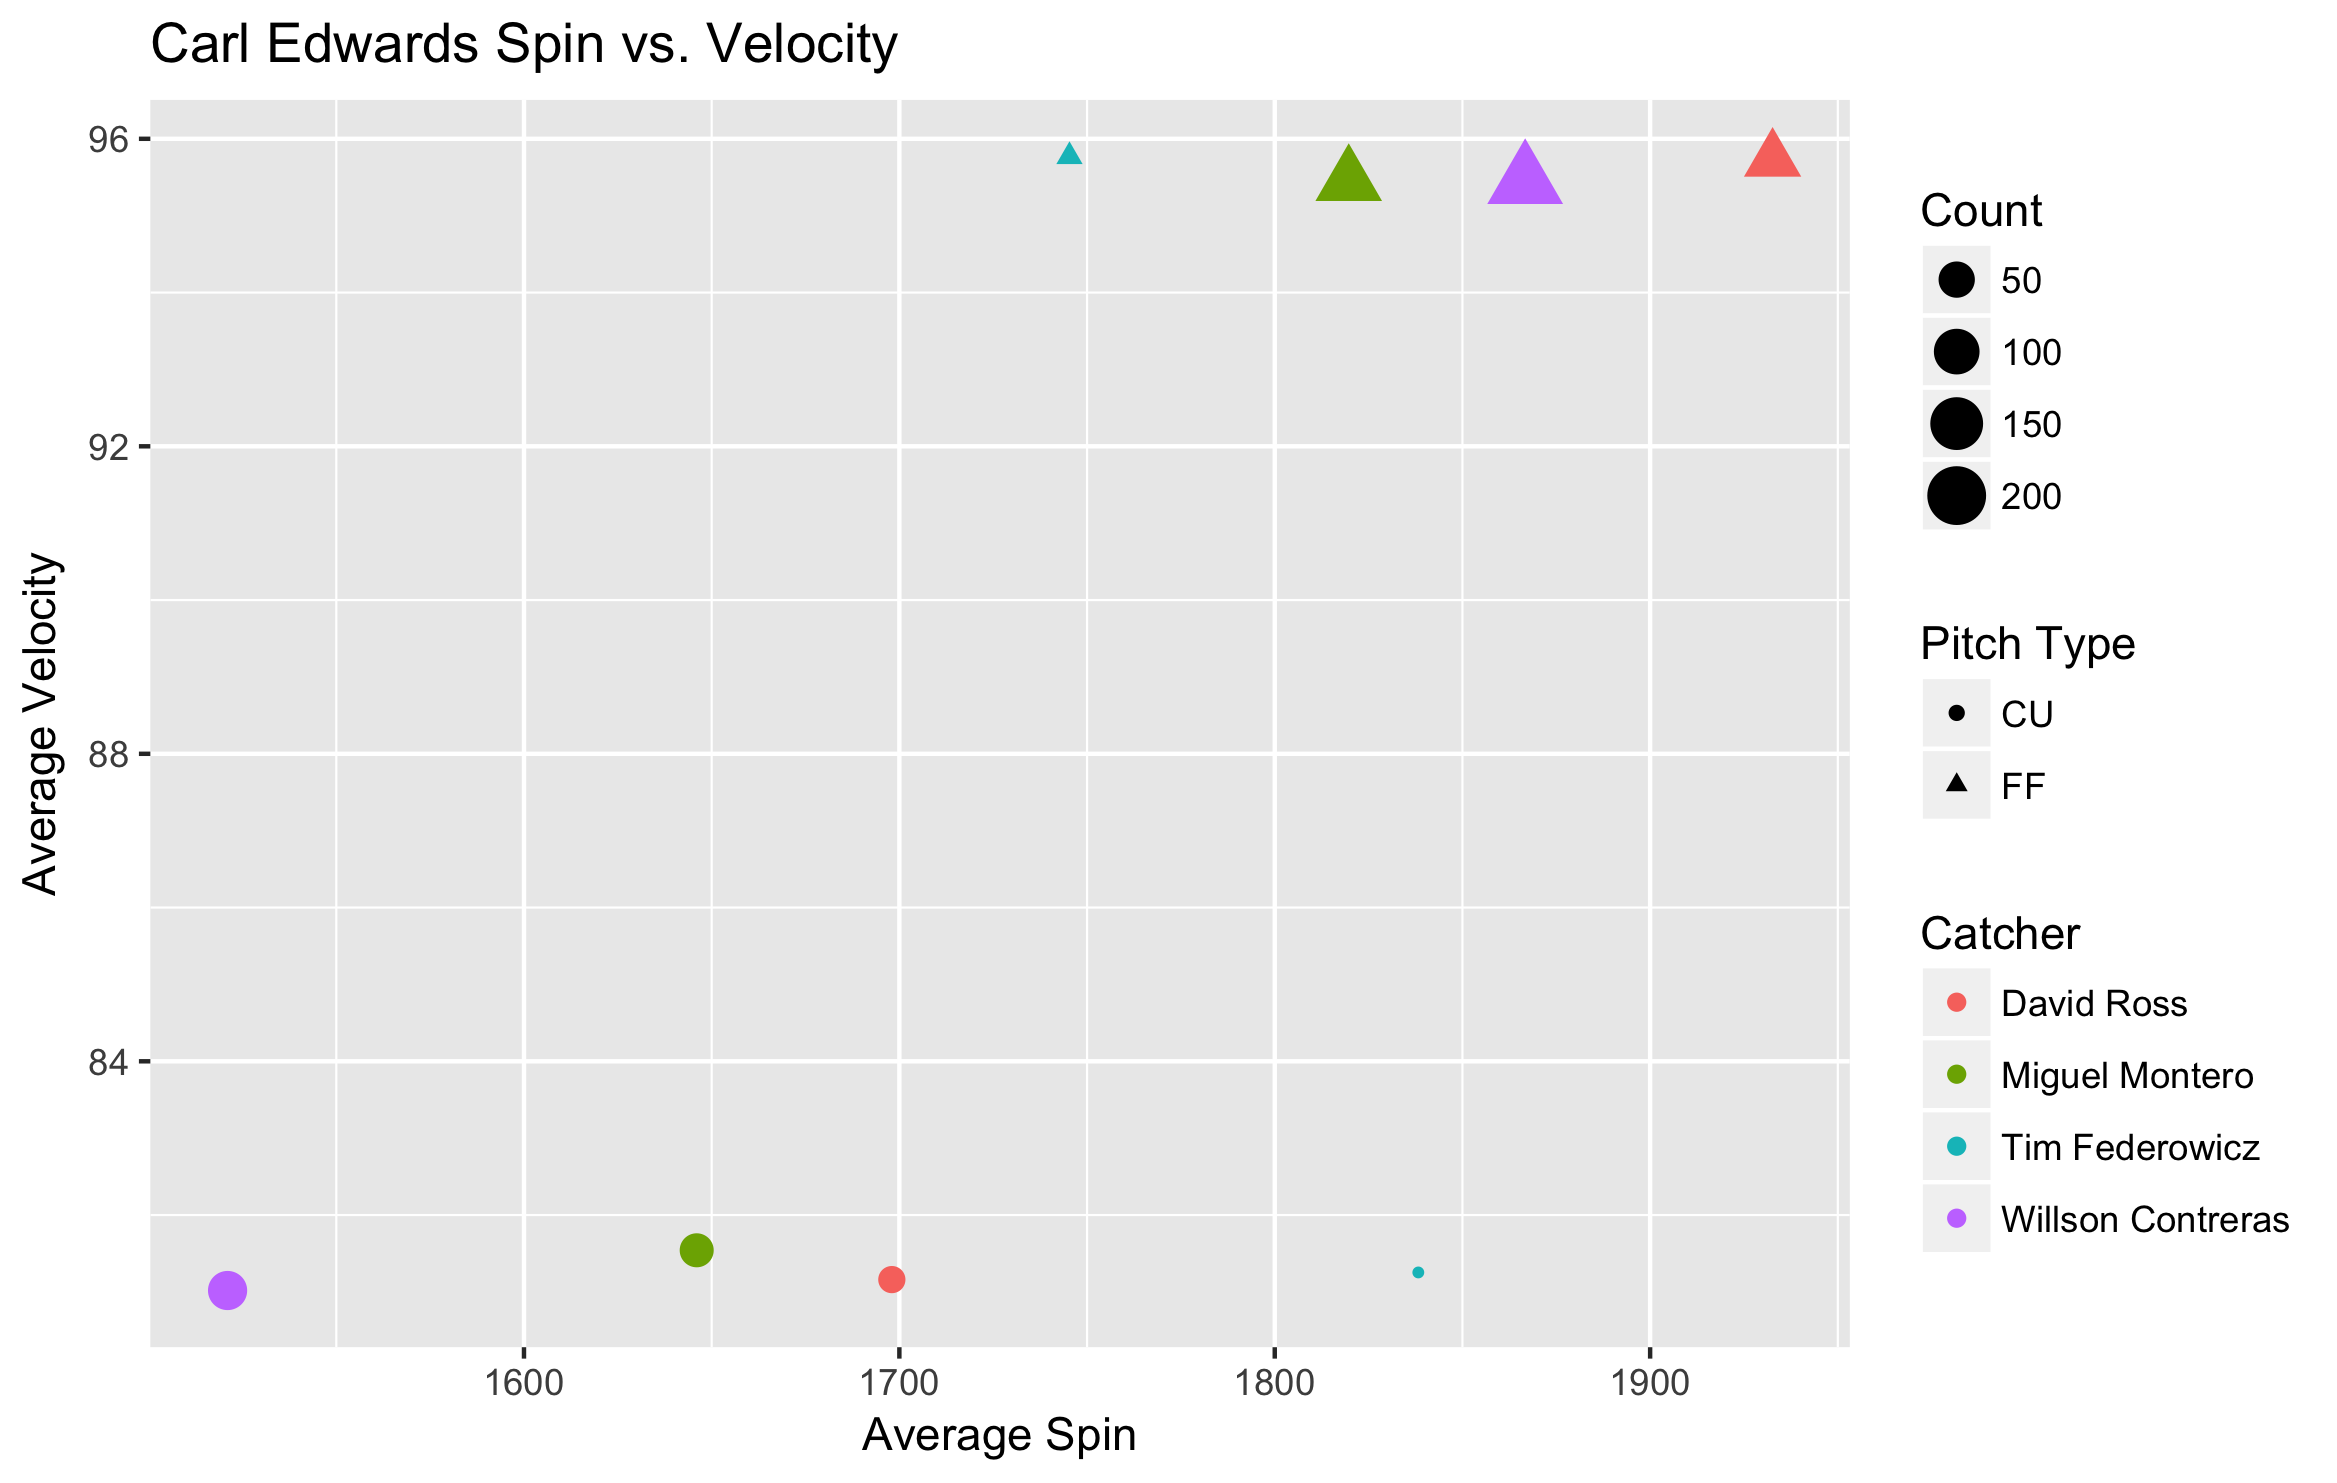
This chart, plotting spin against pitch velocity, shows something interesting: Edwards’ pitches had the highest spin when throwing to Ross. Curveballs with higher spin tend to induce more ground balls2, which is advantageous for Edwards thanks in part to the defense behind him. High spin on his four-seamer is essential to Edwards’ style, and that was maximized when Ross was catching. Of course, this isn’t necessarily related to the catcher. It could be the case that Ross just happened to catch Edwards on his better days. For greater parity, we can look to see what happens to Contreras’ numbers if we take away the two worst games in Edwards’ season.
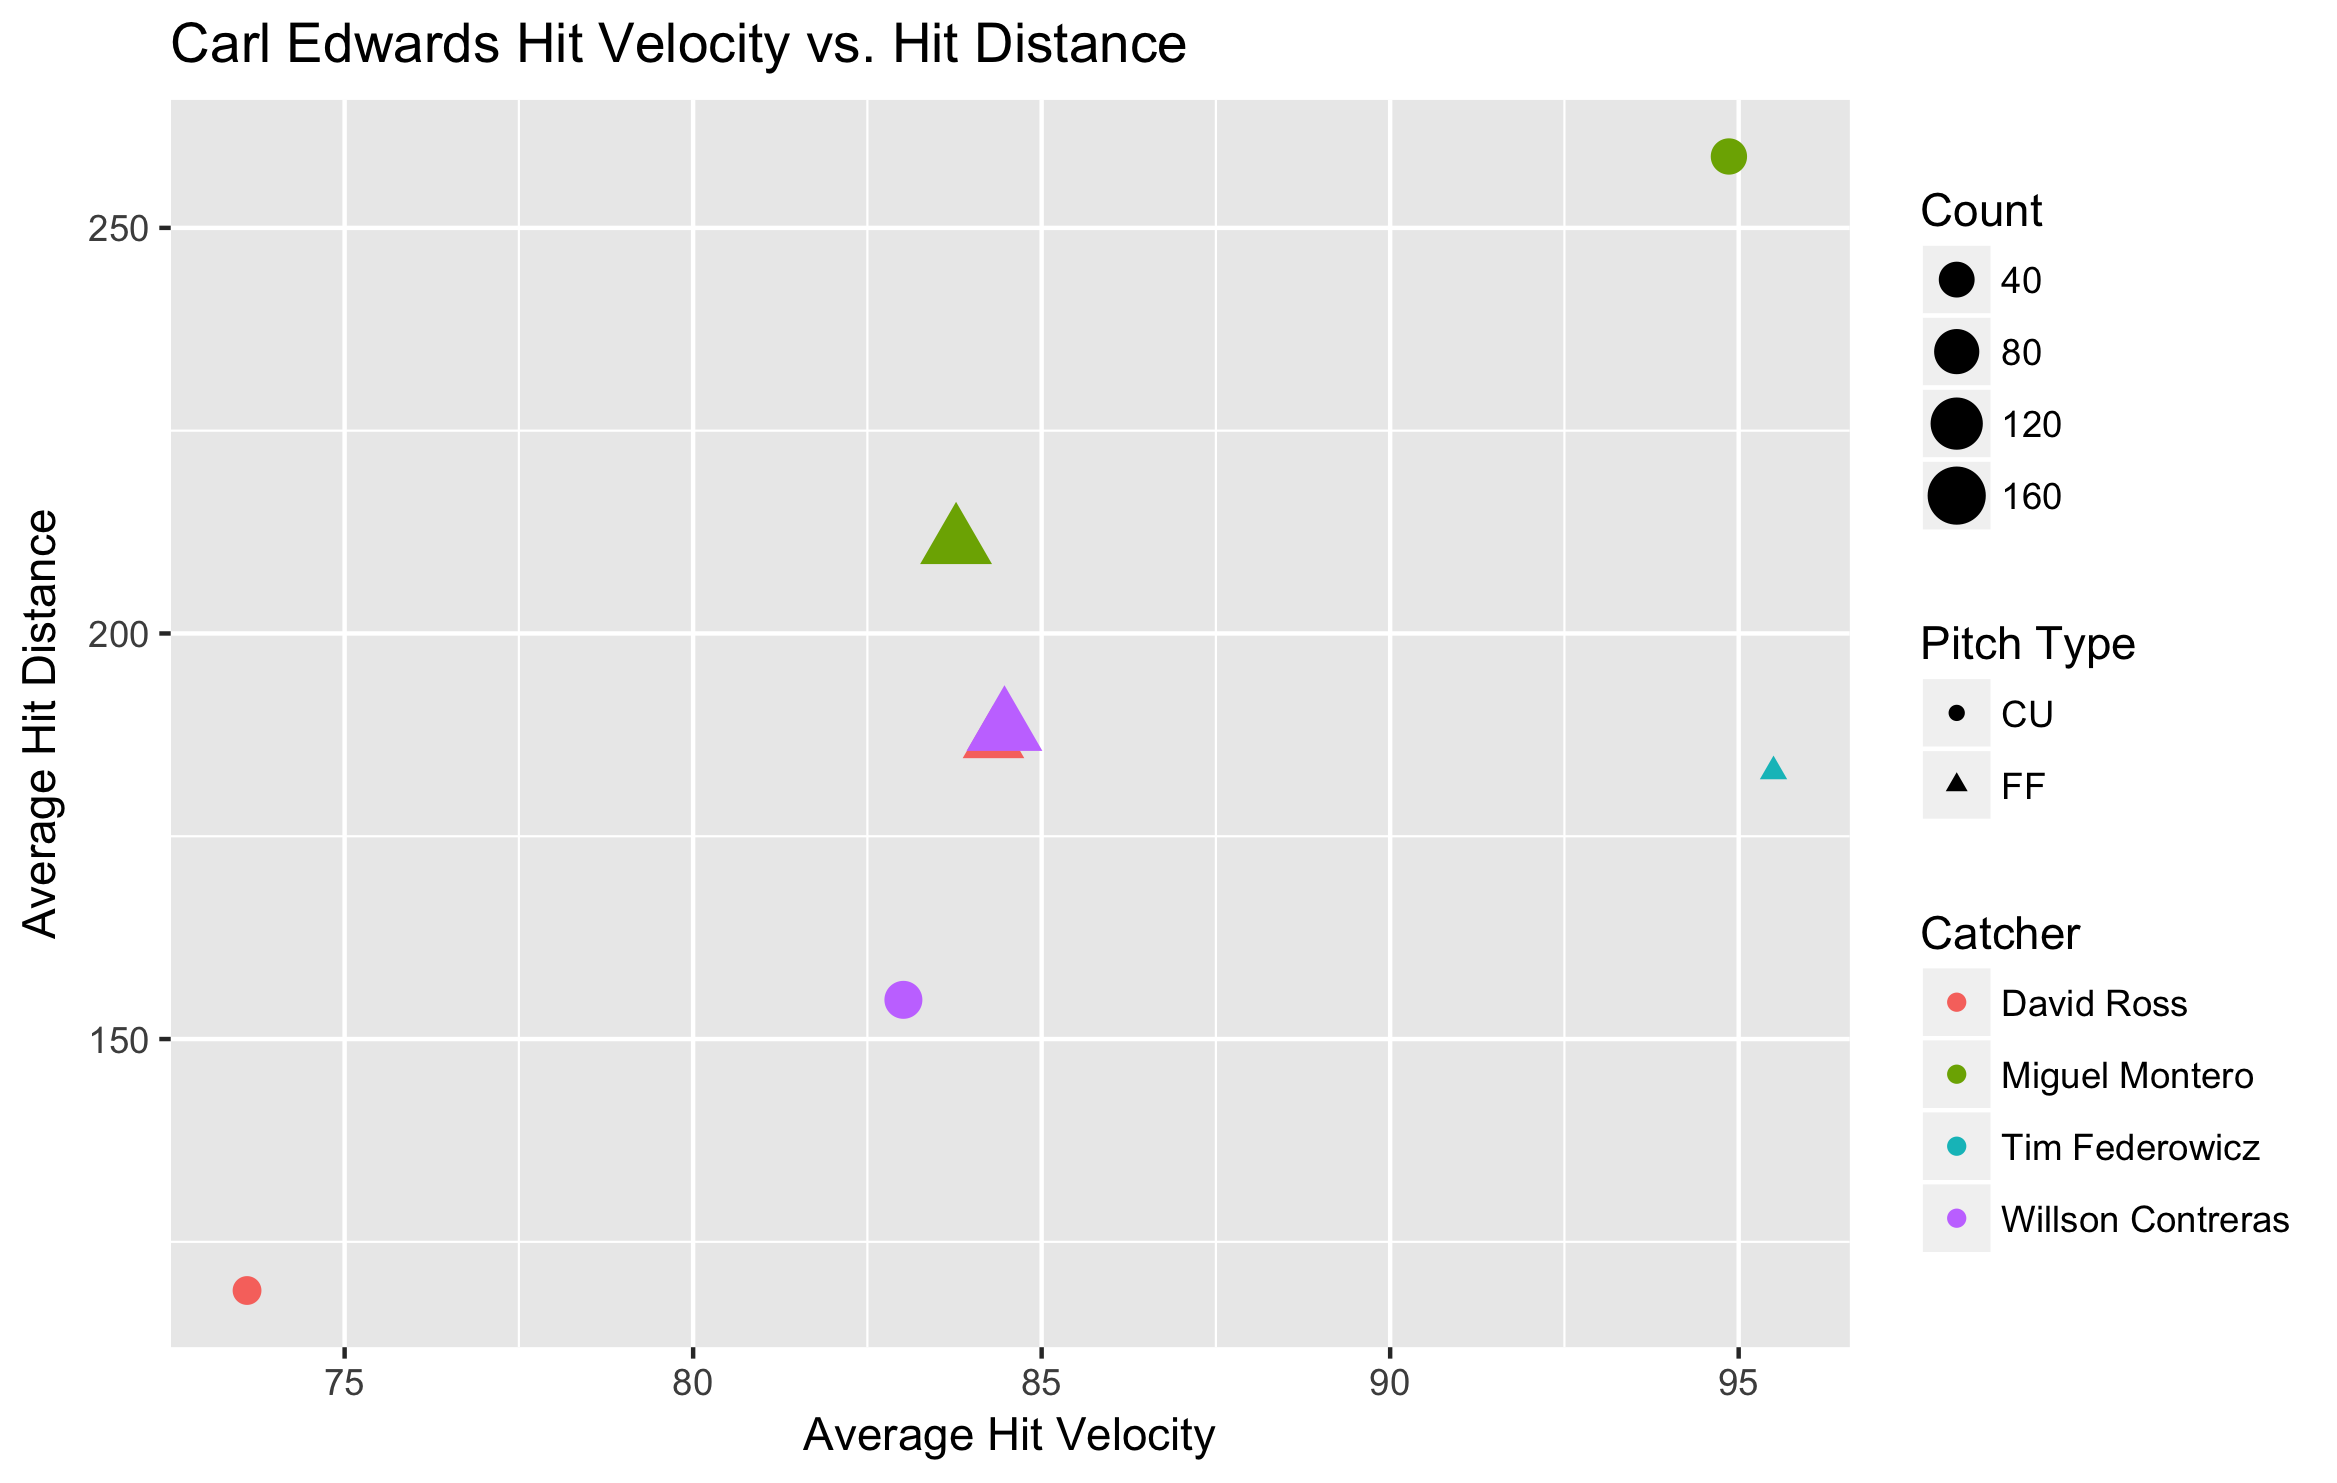
Already we see that removing the two bad outings brings Contreras much closer to Ross and Montero in terms of average hit speed and hit distance. Now we can look at how removing the bad outing affects velocity and spin.
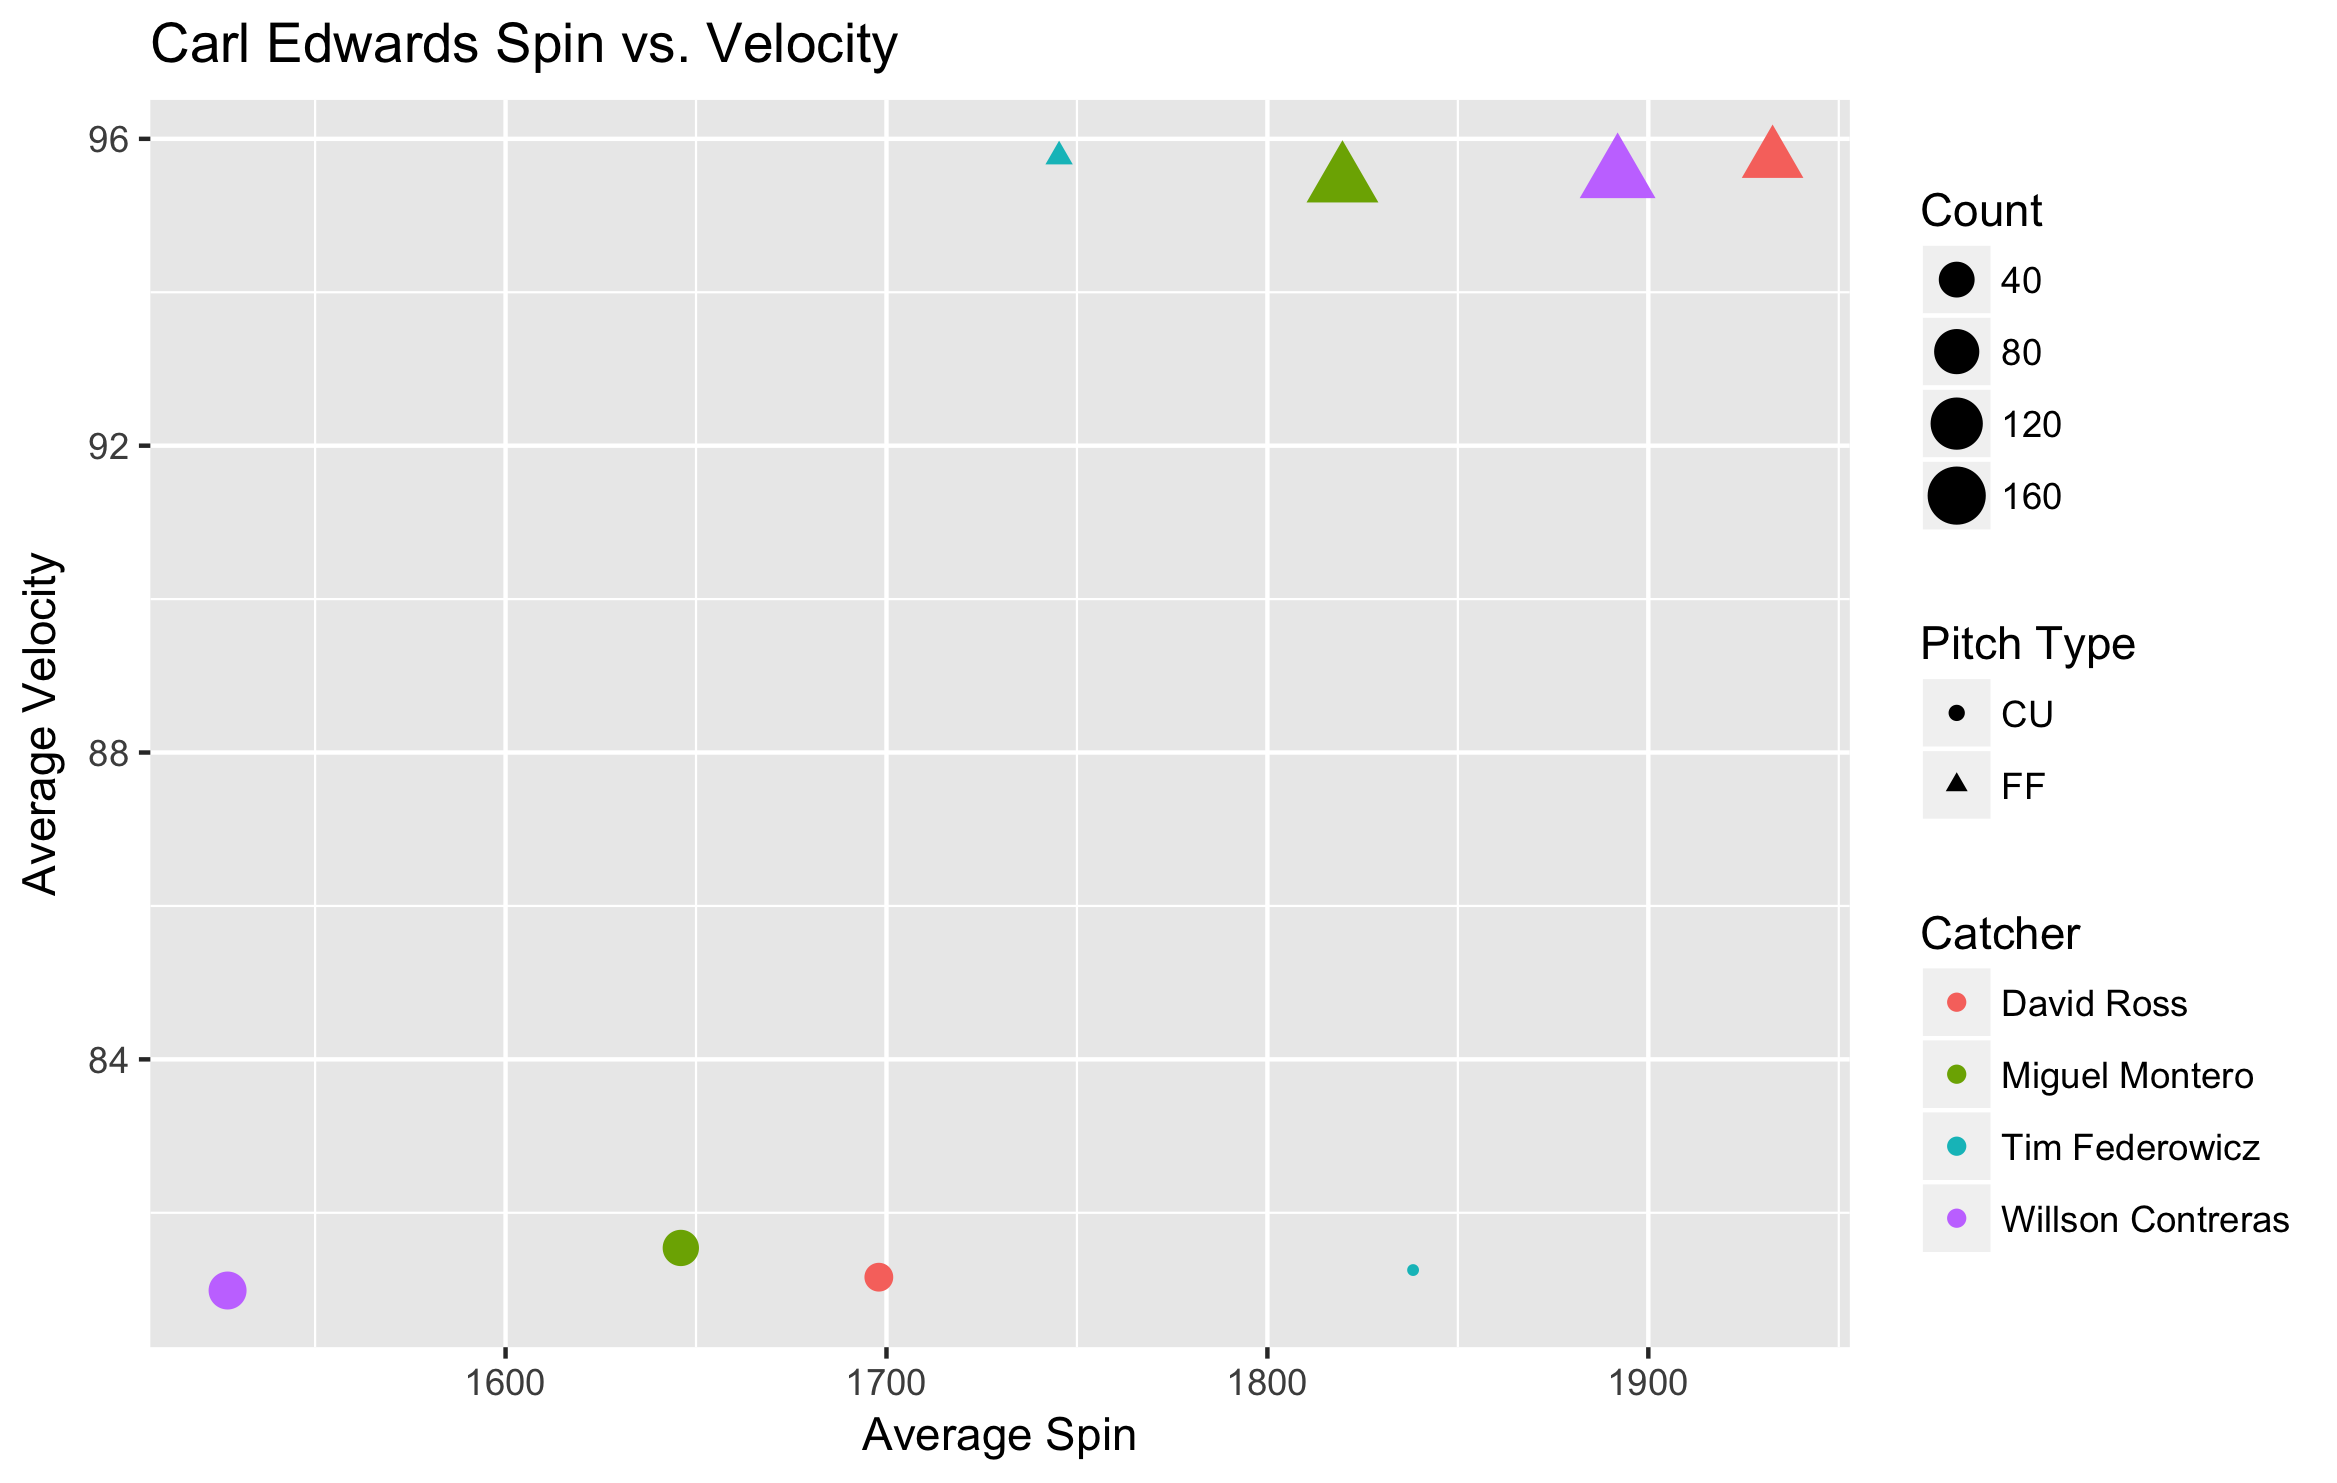
There isn’t any effect on the spin of Edwards’ curveball while Contreras is catching, but the spin on his fastball gets much closer to Ross than Montero. Let’s compare Edwards’ Statcast data between the August 13th outing and his overall averages (the bolded rows are from the 13th):
| Type | MPH | Spin | Ext |
|---|---|---|---|
| FF | 95.55 | 1876 | 6.85 |
| FF | 94.60 | 1602 | 6.73 |
| CU | 81.20 | 1605 | 6.31 |
| CU | 81.49 | 1480 | 6.19 |
If we add in the other poor outing:
| Type | MPH | Spin | Ext |
|---|---|---|---|
| FF | 95.54 | 1873 | 6.85 |
| FF | 95.08 | 1749 | 6.74 |
| CU | 81.23 | 1610 | 6.31 |
| CU | 81.12 | 1502 | 6.26 |
Adding in the second bad outing makes the numbers more similar, lending credence to the idea that the first outing was an outlier. On August 13th the spin on his fastball, his extension, and his velocity were all down a tick.
Carl Edwards had a quietly great year out of the bullpen for the Cubs. He was among the league leaders in wOBA-against, which is initially surprising based on his peripheral numbers. Upon removing an outing where the spin rate and velocity on his signature pitch took a steep downturn, Edwards’ peripheral numbers match up more closely with the type of performance you’d expect from someone in that elite group of pitchers. Carl Edwards had a bad day—here’s to more good ones.
- As part of this analysis, I defined a function
playername_lookupthat gets a player’s name from their MLBAM id (this function is based on theplayerid_lookupfunction from thebaseballrpackage). It is provided here for reference. [return] - http://m.mlb.com/news/article/160896926/statcast-spin-rate-compared-to-velocity/ [return]